KEY TAKEAWAYS
- An income statement is a financial statement summarizing a company’s performance over a period.
- Common accounts found on an income statement include:
- COGS (Cost of Goods Sold): This reflects the direct costs attributable to the production of goods or services sold by the company.
- Operating Expenses: These are expenses incurred through normal business operations, such as rent, utilities, and salaries.
- Operating Income: This is the profit realized from business operations after deducting operating expenses from gross profit.
- Taxes: Calculations related to governmental tax obligations.
- Net Income: The final profit remaining after all expenses and taxes are subtracted from total revenues.
- Depending on the complexity of the business’s financial activities, the accounts on the income statement can be much more sophisticated.
Unpacking Income Statement Accounts
Revenue Accounts Explained
Revenue accounts on an income statement capture the total income generated by a company through its core business activities. These accounts often include sales revenue, service revenue, and other income streams from primary operations. Sales revenue is typically the largest component, representing income from selling goods or services. Other specific revenue types might include rental income or interest earned, depending on the business. An essential aspect of these accounts is their integration into the general ledger, where they summarize overall income that directly impacts the equity account through accounting entries. This ensures accurate financial results and verification of financial statements. Bookkeeping plays a crucial role in maintaining the accuracy of these records, as every transaction will affect both an income statement account and a balance sheet account. Understanding these accounts provides clarity on a company’s capability to generate income fundamentally tied to its primary offerings. For instance, a retail company will focus on sales revenue from product sales, while a service-oriented business might rely heavily on service fees. Recognizing differences in these revenue sources helps you assess a business’s operational health and market standing. By dissecting revenue streams, evaluate which segments are thriving and identify potential areas for growth, ensuring that the ending balance is accurately reflected at period end.
Understanding Expense Accounts
Expense accounts on an income statement reflect the costs incurred by a business in generating revenue. These may include fulfillment, technology, research and development (R&D), and stock-based compensation (SBC). Recognizing these ensures businesses account for all necessary expenditures accurately.
Primary and Secondary Activity Expenses
Delving into Primary-Activity Expenses
Primary-activity expenses are directly linked to a company’s core business operations. These include the cost of goods sold (COGS), which represents the total cost of producing or purchasing the goods that a company sells during a specific period. This category also encompasses expenses like raw materials, labor directly associated with production, and manufacturing costs. For a service-based business, primary expenses might involve direct labor costs and expenses incurred to deliver the service. Additionally, businesses often explore different classifications of expenses to optimize financial reporting and strategic planning.
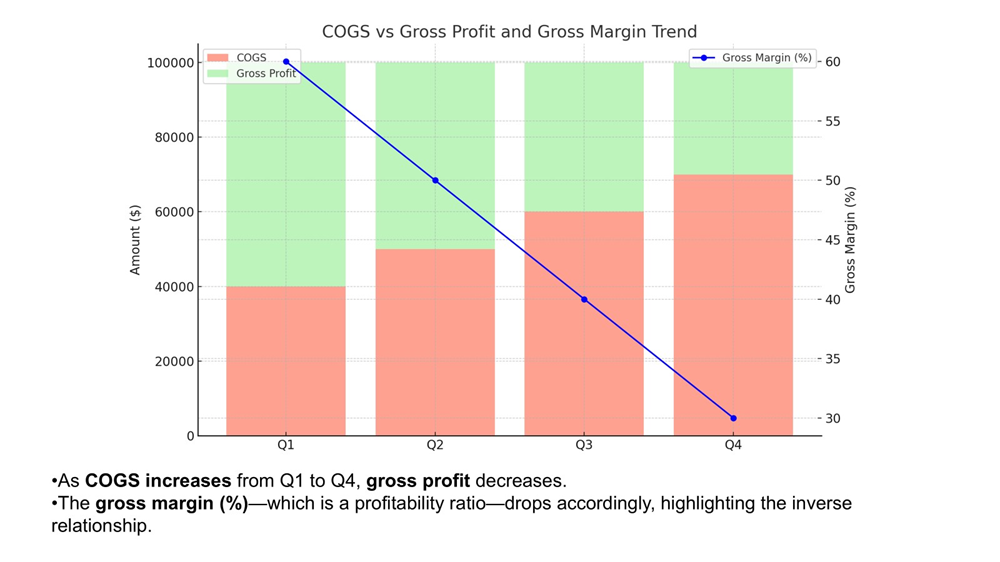
Depreciation and amortization, although not direct expenses of primary activities, are important to consider as they provide a clear picture of spreading out the costs of capital assets over time. These expenses offer valuable insights into a company’s operational efficiency and cost-control measures. A rising COGS without a corresponding increase in sales could suggest pressure on profit margins or inefficiencies in the production process. Managing these expenses effectively is crucial for maintaining healthy profit margins.
Furthermore, understanding primary-activity expenses allows companies to make strategic decisions, such as sourcing materials more cost-effectively or optimizing labor costs. For businesses in competitive industries, keeping primary expenses in check often translates to a significant advantage in pricing and profitability.
Insights on Secondary-Activity Expenses
Secondary-activity expenses pertain to costs incurred from activities that are not central to a company’s core operations. These include administrative expenses, interest expenses, and non-direct operational costs such as legal fees, marketing, office supplies, and utilities. While secondary in nature, these expenses still have a significant impact on the company’s overall profitability, with compensation expense being a notable component in industries reliant on skilled labor.
Secondary expenses often fluctuate based on strategic decisions, such as launching marketing campaigns or expanding office spaces. For instance, an increase in marketing expenses might be due to efforts to boost brand awareness, which could potentially lead to higher future revenues. An important takeaway is understanding how variable these costs can be based on strategic maneuvers.
Managing secondary-activity expenses is pivotal in optimizing overall efficiency. Excessive administrative costs can erode profitability, highlighting the importance of regular reviews and efficiency improvements. By understanding and controlling these expenses, businesses can better allocate resources to initiatives that directly contribute to growth and operational success.
Operating vs. Non-Operating Revenue
Distinguishing Operating Revenue
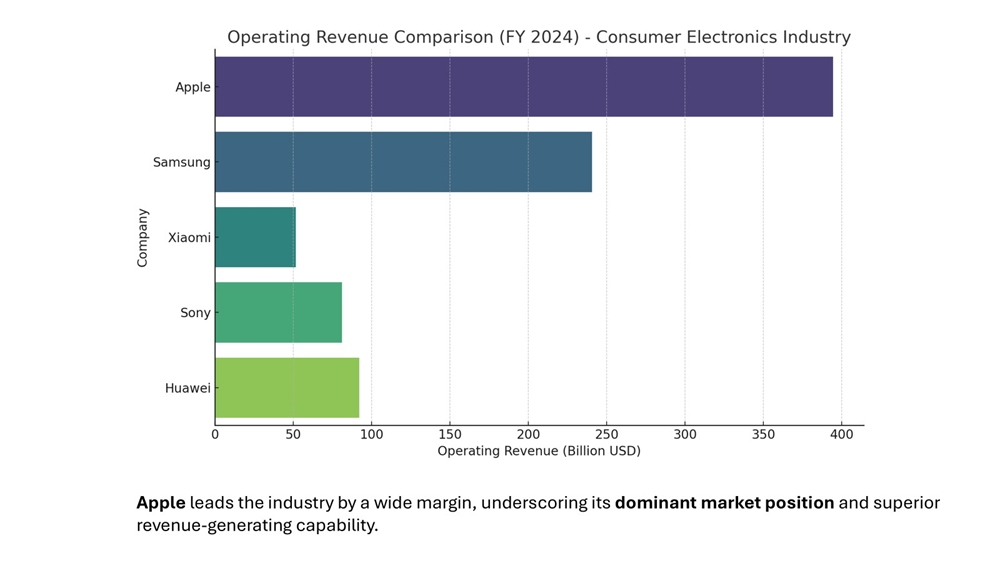
Operating revenue is generated from a company’s primary business activities and is crucial for assessing its core operational health. For example, a retailer’s operating revenue comes from sales of merchandise, while a consulting firm earns it through service fees. This consistent income stream reflects a company’s ability to maintain and grow its core offerings, making it a key indicator of business sustainability. Operating revenue is often the largest component of total revenue and directly correlates with business activity. Analyzing trends in operating revenue over time reveals insights into the performance and demand for the company’s primary products or services. Note that significant growth in this revenue type typically indicates successful business strategies and market adaptation.
Understanding operating revenue helps to clarify how well a company is leveraging its primary market position. It is a strong measure of the company’s success in maintaining competitive advantage and profitability within its main market sector. For instance, successfulwaiting in key markets often signals effective strategic planning and can enhance long-term growth prospects.
Analyzing Non-Operating Revenue
Non-operating revenue comprises income that is derived from activities outside a company’s core operations. Common examples include interest income from investments, dividends from owned stocks, and profits from the sale of assets. Additionally, royalty income, which is earned through the use of a company’s intellectual properties, is another form of non-operating revenue. Although this type of revenue is not a direct result of primary business activities, it can provide beneficial financial support and serves as an indicator of other successful company investments or strategies. The presence and size of non-operating revenue can vary significantly between companies and over time, depending on their investment strategies and economic conditions. For instance, a company with significant dividend income may have extensive investment holdings, showcasing robust portfolio management. While non-operating revenue can enhance financial stability, leaning heavily on it for total revenue can indicate that a business needs to strengthen its primary operations. In summary, analyzing non-operating revenue helps you assess diversification efforts and understand additional financial buffers a company might have in place.
Gains and Losses: Impact on the Bottom Line
Recognizing Gains in Income Statements
Gains on an income statement represent financial benefits resulting from activities outside a company’s core operations. These can stem from the sale of assets, such as equipment or real estate, at a higher price than their book value. A blog can be a great platform to delve deeper into specific examples, like how gains can also arise from one-time financial transactions that positively impact the bottom line, such as favorable currency exchange rate movements. While they boost profitability, gains are typically non-recurring and unpredictable. For instance, selling a company building at a significant profit will produce a noticeable gain but won’t alter the ongoing operational profitability of the business. Recognizing these gains provides insight into how well a company capitalizes on external opportunities or maximizes asset value. However, sustainable growth and profitability should primarily come from core operations rather than reliance on infrequent gains. Analyzing these factors offers an understanding of a company’s comprehensive financial strategy and its ability to leverage additional financial opportunities. A blog can be particularly effective in exploring diverse perspectives, such as expert quotes, enhancing reader engagement.
Accounting for Losses as Expenses
Losses in an income statement depict financial detriments incurred due to transactions unrelated to primary business operations. Examples include losses from asset sales below their book value or damage from unforeseen events like natural disasters. Losses reduce overall profitability and, unlike regular operational expenses, often occur sporadically.
Recognizing losses as expenses is essential for a realistic assessment of a company’s financial health. They highlight areas where financial setbacks have occurred, prompting businesses to develop better risk management strategies. For instance, a company experiencing repeated losses from equipment sales might reconsider its depreciation methods or asset management policies.
While occasional losses are inevitable, consistent reporting of losses can indicate operational inefficiencies or strategic missteps. It’s vital to analyze both the magnitude and frequency of these losses to gauge potential impacts on the business’s financial stability and to formulate mitigation strategies.
Comparing Income Statement Structures
Single-Step Income Statement
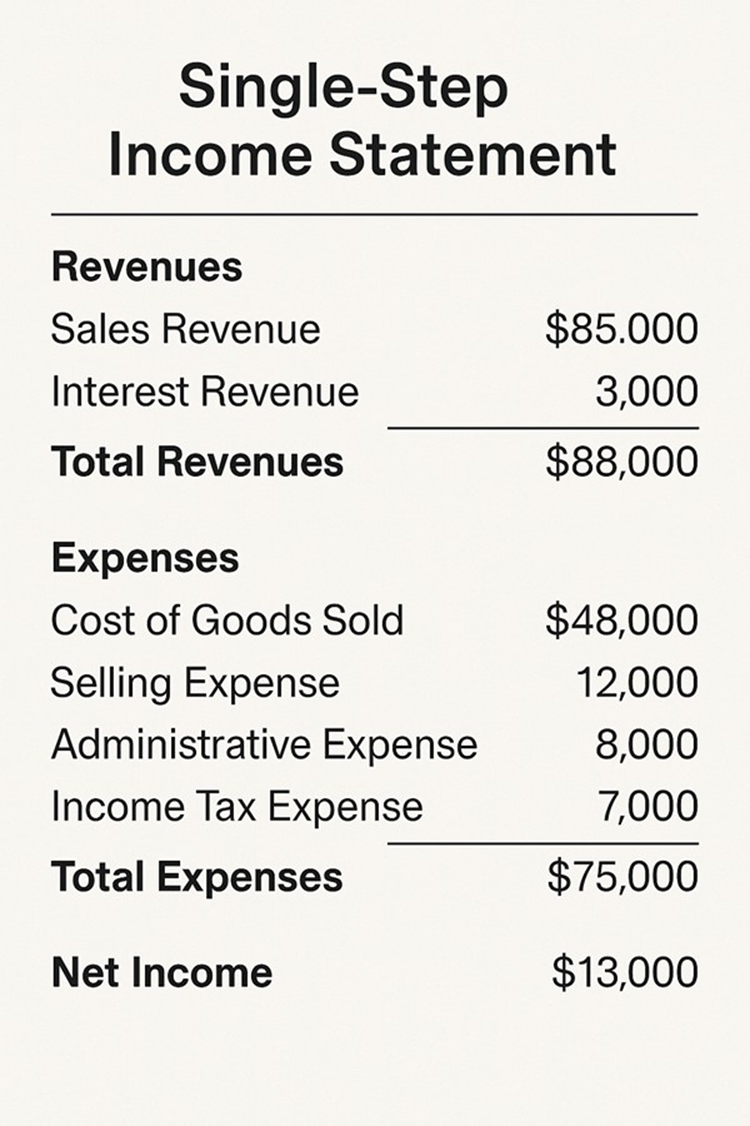
A single-step income statement simplifies financial reporting by aggregating all revenues and gains, then subtracting all expenses and losses in one straightforward calculation. This format provides a clear snapshot of net income without allocating expenses into operating and non-operating categories.
Primarily used by smaller businesses, this method highlights overall profitability through a streamlined approach. Its simplicity makes it accessible for those less familiar with accounting concepts, as it avoids detailed categorization.
However, the single-step income statement offers less detail about the operational performance of a business, potentially obscuring important financial nuances. While it efficiently showcases net profit, it does not provide insights into specific expense types or revenue sources, making it less ideal for detailed financial analysis or strategic decision-making.
Multiple-Step Income Statement
A multiple-step income statement provides a more detailed and nuanced view of a company’s financial performance compared to the single-step format. It breaks down revenues and expenses into different sections, typically distinguishing between operating and non-operating activities. This format begins with gross profit, calculated by subtracting the cost of goods sold (COGS) from total sales revenue. It then details operating income by subtracting operating expenses such as selling, general, and administrative expenses from the gross profit.
The multiple-step statement offers insights into a company’s core business efficiency, highlighting operational effectiveness by isolating regular business activities from non-operational ones. This level of detail allows for better analysis and understanding of financial trends and strengths, offering a granular view of profit margins at various points.
This approach is beneficial for larger companies and stakeholders who require comprehensive analysis for decision-making. However, its complexity may require more accounting expertise and interpretation, which could be seen as a drawback for smaller firms or those with limited financial resources.
Preparing an Income Statement: A Step-by-Step Guide
Initial Data Compilation
The initial data compilation for preparing an income statement involves gathering all financial data pertinent to revenues and expenses over a specific accounting period. This step is critical as it lays the groundwork for accurate financial reporting. Begin by collecting detailed records of all sales transactions to determine total revenue, including any discounts or returns. Concurrently, amass documentation on all operational costs and expenses, ensuring completeness and accuracy.
Key data points include sales receipts, invoices, bank statements, and expense reports. It is also essential to account for inventory levels and their changes to calculate the cost of goods sold accurately. For this phase, maintaining an organized and detailed accounting system is beneficial to facilitate data collection and ensure nothing is overlooked.
The thoroughness at this stage sets the tone for a precise income statement, so prioritize accuracy and comprehensiveness. Proper records not only enhance the integrity of the financial report but also bolster confidence in financial decision-making processes.
Structuring the Format
Structuring the format of an income statement involves organizing the compiled data into a coherent structure that logically flows from revenue to net income. Begin by listing all revenue sources at the top, clearly delineating operating and non-operating revenues. This helps distinguish between core and ancillary income streams.
Next, detail the cost of goods sold (COGS) to calculate the gross profit, which highlights the direct profitability from primary operations. Follow this with a section on operating expenses, including categories like selling, administrative, and depreciation expenses, to arrive at operating income. This structure offers a clear view of the company’s efficiency in managing costs related to core business activities.
Proceed by documenting any non-operating revenues and expenses, such as interest and taxes, which bring clarity to net income. Using a structured format not only improves readability but ensures that every component connects logically, aiding in strategic analysis. This organized approach allows stakeholders to quickly identify strengths and potential areas for improvement.
Final Review and Adjustments
The final review and adjustments stage of preparing an income statement ensures accuracy and completeness before the statement is finalized. Start by thoroughly checking all figures to verify that they match the financial records and calculations are correct. Look for any inconsistencies or anomalies in revenue and expense entries, ensuring nothing has been inadvertently missed or misrecorded.
Pay special attention to the alignment of financial data with accounting standards and principles. This step might involve making necessary adjustments for accruals or deferrals to align income and expenses with the correct accounting period.
Once the data review is complete, additional insight can be gained by comparing the current statement with previous periods to identify trends or significant changes. This final examination helps in validating the integrity of financial information, which supports strategic planning and decision-making.
Conclude by having a financial expert or auditor verify the statement, providing an extra layer of assurance and credibility. This enhances stakeholder confidence and ensures that the income statement reliably reflects the financial performance of the business.
FAQs
What is the definition of income statement in simple terms?
An income statement is a financial document that shows a company’s revenue, expenses, and profit over a specific period. It’s like a report card for a business’s financial performance, indicating how much money is being made and spent, ultimately revealing whether the company is making a profit or a loss.
What are the four key elements of an income statement?
The four key elements of an income statement are:
- Revenue: The total income generated from the sale of goods and services.
- Cost of Goods Sold (COGS): Direct costs associated with producing goods sold by the company.
- Operating Expenses: Costs required to run the business, such as salaries and rent.
- Net Income: The final profit or loss after all revenues and expenses have been accounted for.
How do operating revenues differ from non-operating revenues?
Operating revenues are earned from a company’s primary business activities, like sales of products or services. Non-operating revenues, on the other hand, come from secondary activities, such as interest income, dividends, or profits from asset sales. Operating revenues indicate core business performance, while non-operating revenues highlight additional income sources.
What is included in an income sheet?
An income sheet, or income statement, includes revenues, expenses, gains, and losses. It details operating revenue from primary business activities, subtracts costs like COGS and operating expenses, and factors in non-operating items such as interest and taxes. This provides a summary of the company’s net income or loss during the reporting period.
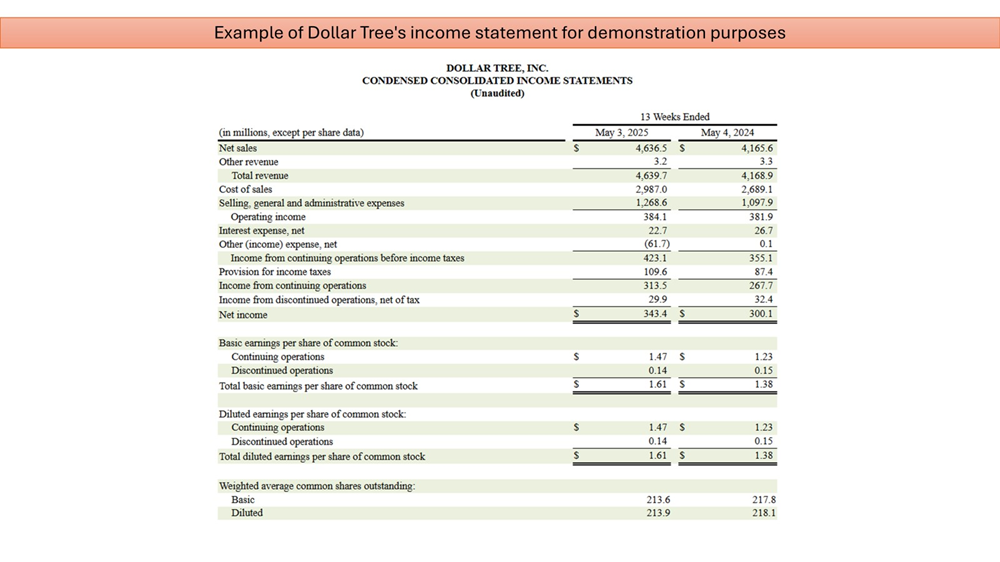
What accounts are shown in example of income statements?
Example income statements typically display accounts such as sales revenue, cost of goods sold (COGS), gross profit, operating expenses (like selling and administrative expenses), operating income, non-operating revenues (such as interest income), non-operating expenses (like interest expense), and net income. These accounts provide a complete picture of a company’s profitability.
What is the formula of income statement?
The basic formula for an income statement is:
Net Income = Total Revenue – Total Expenses
This incorporates all revenues, including operating and non-operating, and subtracts total expenses, covering COGS, operating, and non-operating expenses, to calculate the company’s net profit or loss for the period.