KEY TAKEAWAYS
- Profitability ratios, including gross profit margin, operating profit margin, and net profit margin, provide critical insights into a company’s pricing, cost control, and overall financial efficiency.
- Regular tracking of profitability ratios allows businesses to make informed decisions, compare performance against industry peers, and evaluate trends for better financial planning.
- Understanding profitability ratios like ROA (Return on Assets) and ROE (Return on Equity) can help investors and stakeholders assess a company’s ability to generate wealth and sustainably manage its operations.
Simplifying Profitability Ratios
What Are Profitability Ratios?
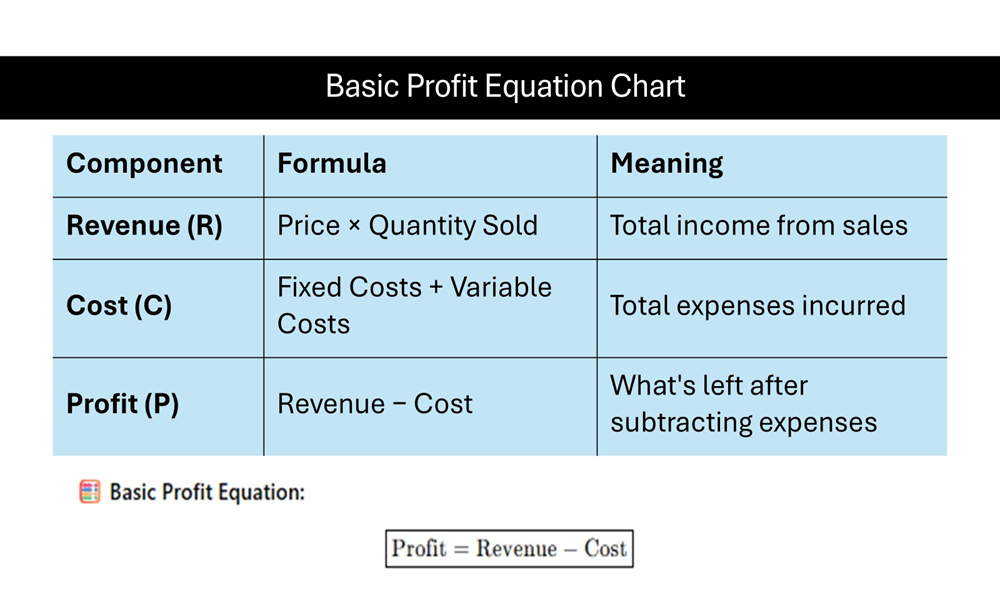
Profitability ratios are financial metrics used to evaluate a company’s ability to generate profit relative to its revenue, operating costs, balance sheet assets, or shareholders’ equity during a specific period. These ratios provide insights into how well a company is using its resources to manage expenses and generate earnings. By analyzing these ratios, stakeholders can discern the company’s operational efficiency, effectiveness in cost management, and overall financial performance.
Why Are Profitability Ratios Important?
Profitability ratios are crucial because they offer a window into the financial well-being of a company. They allow investors, creditors, and management to assess how effectively a company is generating profit and managing its resources. These ratios are instrumental in decision-making processes, guiding strategies for business expansion, cost control, and revenue enhancement. Additionally, they facilitate comparison with industry peers, helping a business understand its position in the marketplace.
Types of Profitability Ratios Explained
Gross Profit Margin
The gross profit margin is a key indicator of a company’s financial health. It represents the percentage of revenue that exceeds the cost of goods sold (COGS), calculated using the gross margin ratio formula: [Sales – Cost of Goods Sold] / Sales. This ratio is essential for understanding how efficiently a company is producing its products. A higher gross profit margin indicates that a company retains more capital after covering the basic production costs, which is vital for funding operating expenses, paying off debt, and delivering shareholder value. Additionally, evaluating the gross margin ratio can provide insights into inventory management practices, as optimizing inventory can significantly impact profitability.
Top 5 Features:
- Indicates the efficiency of production processes.
- Reflects pricing strategies and cost control.
- Provides a buffer to absorb other operating expenses.
- Helps identify trends over time.
- Allows comparison with industry peers.
Benefits:
- Improves financial health assessment.
- Assists in pricing strategy reviews.
- Guides decisions on reducing production costs.
- Informs investors about earning potential.
- Enhances business model evaluation.
Cons:
- May fluctuate significantly across industries.
- Can be affected by external economic factors.
Best For: Companies seeking to evaluate and enhance their production efficiency, inventory management, and pricing strategies.
Operating Profit Margin
The operating profit margin measures what percentage of a company’s revenue is left after paying for variable costs of production, such as wages and raw materials, but before interest and tax. It provides insights into operational efficiency and is a crucial indicator of a company’s ability to remain profitable over time, even if volumes fluctuate. Additionally, unlike the EBITDA margin ratio, which excludes non-operating expenses, the operating profit margin takes a comprehensive view by including overhead and all operating expenses. Moreover, businesses often interact with suppliers to negotiate terms that improve profitability and help maintain a robust operating profit margin.
Top 5 Features:
- Directly linked to cost management capabilities.
- Reflects core business productivity and operational efficiency.
- Used to assess profitability trends over time.
- Influences investor confidence.
- Facilitates comparison with industry averages.
Benefits:
- Enhances understanding of operational management.
- Identifies cost control effectiveness.
- Supports long-term financial strategy development, such as planning for purchase inventory.
- Boosts confidence in management’s capability.
- Provides a comprehensive view of ongoing business operations. It assists stakeholders in understanding how the company manages its overhead to maintain profitability.
Cons:
- Doesn’t account for debt or tax obligations.
- Can be influenced by non-recurring expenses.
Best For: Organizations focusing on fine-tuning their operational processes and controlling costs to maximize earnings before interest and taxes.
Net Profit Margin
Net profit margin is a comprehensive profitability metric showing the percentage of revenue that remains as profit after all expenses are deducted, including operating costs, interest, income taxes, and one-time items. It reflects the true profitability of a company, providing a clear picture of the bottom line. By accounting for both operating and non-operating expenses, this metric offers a thorough insight into overall financial health.
Top 5 Features:
- Captures overall financial performance.
- Calculates profitability after all expenses.
- Aids in assessing comprehensive financial management.
- Used for comparing profitability between companies.
- Highlights capacity to handle debt, including paying dividends.
Benefits:
- Offers a complete view of financial health.
- Assists in evaluating the company’s pricing strategy’s effectiveness.
- Guides profit reinvestment strategies.
- Signals efficiency in managing expenses and debts.
- Helps identify performance trends and future growth potential.
Cons:
- Affected by extraordinary items.
- May vary greatly due to external economic factors.
Best For: Investors and analysts conducting a thorough evaluation of a company’s profitability and its ability to convert sales into profit efficiently.
Return on Assets (ROA)
Return on Assets (ROA) measures how efficiently a company uses its assets to generate profits. This ratio reflects how well a company converts its investments into net income and is a benchmark for comparing asset efficiency across different industries. Additionally, while ROA focuses on asset utility, equity investments are another critical component in evaluating a company’s overall financial health.
Top 5 Features:
- Assesses overall efficiency in asset utilization.
- Provides insights into capital allocation effectiveness.
- Reflects management’s efficiency in using assets.
- Applicable to companies of varying sizes.
- Useful for cross-industry comparisons.
Benefits:
- Highlights resource management capabilities.
- Aids in assessing profitability from asset investments.
- Helps in strategic planning and operations refinement.
- Provides a viewpoint for potential improvements.
- Informs investors on asset management efficacy, offering a snapshot of financial health.
Cons:
- Can be skewed by asset-heavy industries.
- May not fully represent recent asset acquisitions.
- In periods of economic slowdown, ROA might be affected, thus impacting strategic assessments.
Best For: Companies and investors focused on optimizing investment returns and assessing the efficiency of asset-driven operations.
Return on Equity (ROE)
Return on Equity (ROE) is a key profitability ratio that measures how effectively a company uses shareholders’ equity to generate profit. ROE showcases the relationship between profit and the equity that shareholders have invested, making it a favoured metric for both investors and analysts. It is particularly insightful for assessing returns on equity investments without requiring additional equity capital.
Top 5 Features:
- Reflects profitability relative to equity.
- Measures financial performance efficiency.
- Indicates shareholder value creation, often through dividend payments.
- Useful for assessing management effectiveness.
- Compares profitability across companies in the market, illustrating differences in equity and debt management.
Benefits:
- Highlights potential for high returns on shareholder investments.
- Assists in evaluating management’s performance.
- Aids in strategic financial planning and benchmarking.
- Enlightens investors on returns viability, supporting decisions about equity debt balances.
- Supports decisions regarding reinvestment or distribution of profits.
Cons:
- Can be inflated by excessive debt.
- Limited in applicability for companies with varying capital structures.
Best For: Investors and stakeholders interested in assessing the effectiveness of financial strategies and management’s ability to generate returns using shareholders’ equity.
Calculating and Analyzing Profitability Margins
Key Formulas to Know
Understanding the key formulas behind profitability ratios is essential for accurate financial analysis and strategic planning. Here are the fundamental formulas for each major profitability ratio:
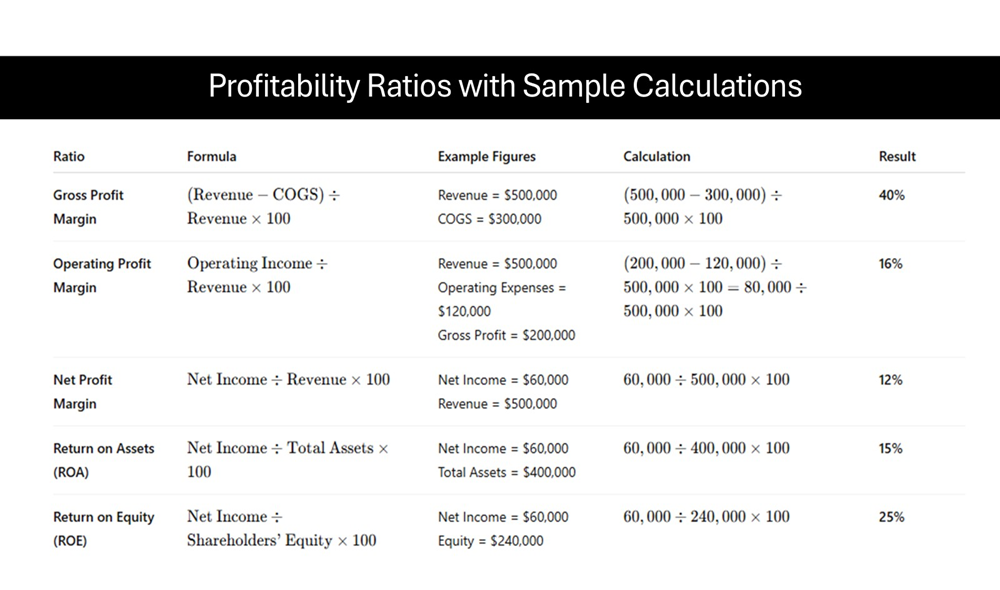
- Gross Profit Margin Formula: ((Revenue − COGS) ÷ Revenue) × 100
- Operating Profit Margin Formula: (Operating Income ÷ Revenue) × 100
- Net Profit Margin Formula: (Net Profit ÷ Revenue) × 100
- Return on Assets (ROA) Formula: (Net Income ÷ Total Assets) × 100
- Return on Equity (ROE) Formula: (Net Income ÷ Shareholders’ Equity) × 100
These formulas simplify the process of analyzing profitability, helping you to interpret financial data effectively and ensure robust financial planning.
Real-World Calculation Examples
Real-world examples of profitability ratio calculations can provide valuable insights into how companies evaluate their financial performance, influencing decision-making processes for bankers and financial analysts. Here are a few illustrative examples using fictional data:
Example 1: Gross Profit Margin
- Company A reports revenue of $500,000 and COGS of $300,000.
- Calculation:((500,000 − 300,000) ÷ 500,000) × 100 = 40%
- Insight: Company A retains 40% of its revenues as gross profit, offering a solid buffer to cover operating expenses, taxes, depreciation, and other costs.
Example 2: Operating Profit Margin
- Company B has operating income of $120,000 on revenue of $400,000.
- Calculation: (120,000 ÷ 400,000) × 100 = 30%
- Insight: Reflects robust operational efficiency, retaining 30% of revenue after operating costs, including depreciation and amortization.
Example 3: Net Profit Margin
- Company C achieves a net profit of $50,000 from total revenue of $200,000.
- Calculation: (50,000 ÷ 200,000) × 100 = 25%
- Insight: Indicates that Company C earns 25 cents in profit for every dollar of revenue, demonstrating strong control over total expenses.
Example 4: Return on Assets (ROA)
- Company D reports net income of $30,000 with total assets valued at $200,000.
- Calculation: (30,000 ÷ 200,000) × 100 = 15%
- Insight: Company D effectively uses its assets to generate profit, with a 15% return.
Example 5: Return on Equity (ROE)
- Company E has net income of $80,000 and shareholder equity of $400,000.
- Calculation: (80,000 ÷ 400,000) × 100 = 20%
- Insight: This performance suggests effective management in creating value for shareholders, reflecting strong ROE.
These examples underscore the practicality and significance of profitability ratios, such as EBITDA and EBIT, in assessing and optimizing a company’s financial performance.
Using Ratios to Drive Business Strategy
Profitability ratios are not just numbers—they are strategic tools that can significantly impact business decisions. By leveraging these ratios, companies can identify strengths, weaknesses, and opportunities within their operations.
Identifying Trends and Opportunities
- Analyze changes in profitability ratios over several periods to spot trends.
- Use increasing margins to justify expanding operations or entering new markets.
- Declining ratios might indicate areas needing cost reduction or efficiency improvements.
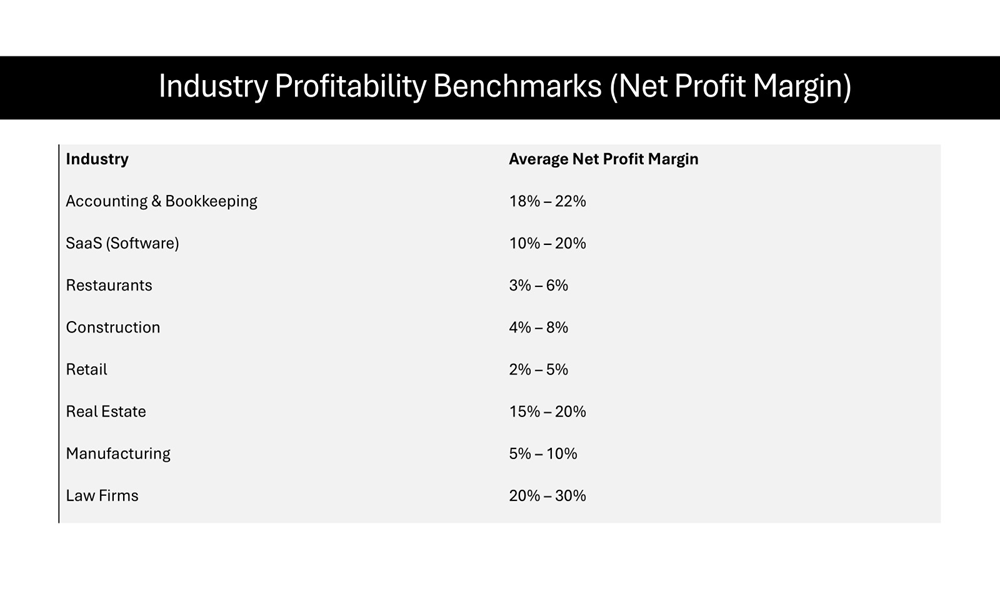
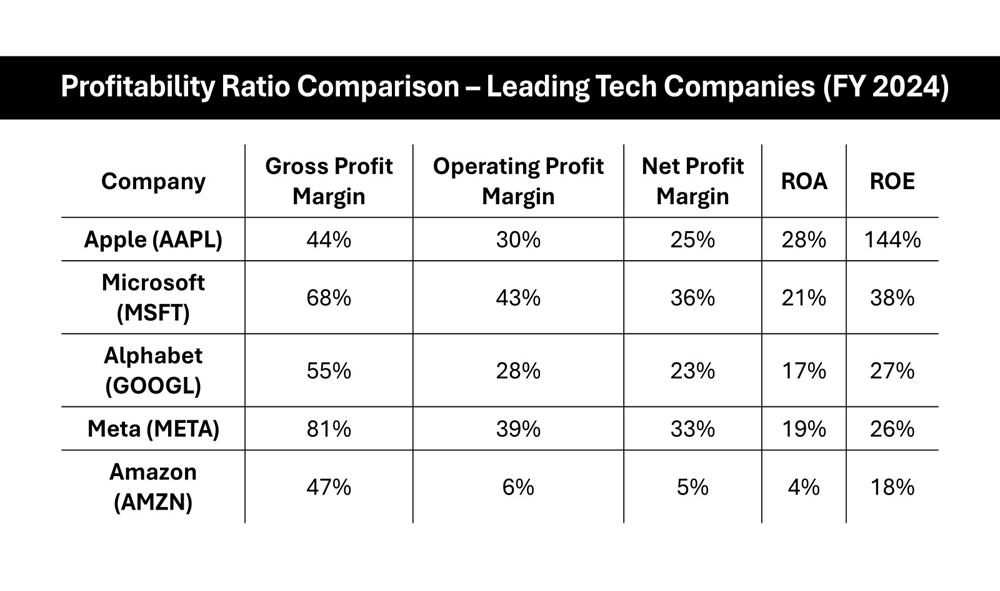
Benchmarking Against Competitors
- Compare your ratios with industry averages to pinpoint areas where your company leads or lags.
- A higher ROA compared to competitors can be a strong selling point to investors and partners.
Strategic Decision-Making
- Gross margins can influence product pricing strategies and supply chain decisions.
- Net profit margins provide comprehensive data for credit considerations and investment proposals.
- ROE can guide strategic decisions about reinvestment in the business versus returning capital to shareholders.
Performance Improvement
- Use operating profit margin to review operational efficiencies and identify cost-saving measures.
- Engage in scenario analysis to predict the impact of strategic shifts on profitability ratios.
Profitability ratios act as a compass, guiding businesses in aligning their strategic objectives with financial realities. By understanding and applying these metrics, companies can optimize performance and better navigate the competitive landscape.
Tapping into Expert Insights
Consulting Services for Businesses
Engaging with consulting services can be a game-changer for businesses looking to enhance their profitability metrics. These services bring expert insights and external perspectives that can help identify areas for improvement and strategic growth.
Benefits of Consulting Services:
- Expert Analysis: Consultants provide in-depth analysis of financial statements and profitability ratios, offering tailored recommendations.
- Strategic Planning: With a clear understanding of profitability metrics, consultants help develop robust business strategies to improve operational and financial performance.
- Benchmarking Capabilities: Consultants often have access to industry data that can be used to benchmark a company’s performance against competitors.
- Comprehensive Solutions: Beyond simple analysis, they provide solutions ranging from cost reduction strategies to revenue enhancement techniques.
- Change Management: Support during strategic transitions to ensure smooth implementation and adoption of new practices.
Choosing the Right Consultant:
- Look for firms with specialized expertise in your industry.
- Consider their track record in improving profitability ratios for similar businesses.
- Evaluate their approach to customizing strategies to fit your unique challenges and goals.
Consulting services offer a valuable partnership in navigating the complexities of financial performance, making them a pivotal resource for businesses striving for enhanced profitability. By leveraging their expertise, you can focus on strategic improvements that yield tangible results.
Tools and Resources for Expertise
Mastering profitability ratios becomes more manageable with the right tools and resources at your disposal. Here are several assets that can help you analyze and apply these critical financial metrics effectively:
- QuickBooks and Xero: These platforms enable detailed financial tracking, making it easier to calculate and monitor profitability ratios. Their ability to enhance liquidity management is crucial for maintaining financial stability.
- Tableau and Power BI: These visualization tools help in creating graphs and dashboards to interpret and communicate financial data clearly.
- Coursera and Udemy: Offer courses on financial analysis and accounting that include modules on understanding and utilizing profitability ratios. Learning about master accounting through these courses can significantly improve financial acumen.
- Webinars: Stay updated with industry trends and profitability strategies by participating in webinars hosted by financial experts.
- Financial Intelligence by Karen Berman and Joe Knight: An excellent resource for making sense of financial reports and mastering ratios.
- Harvard Business Review Articles: Often include insights on applying investment banking strategies and integrating profitability metrics into strategic planning, thereby assisting in accurate valuation.
- IBISWorld and Statista: Provide access to detailed industry reports that can be used for benchmarking profitability metrics. Such reliance on industry data ensures competitive positioning.
- Benchmarking Reports: Utilize available industry-specific reports to compare and contrast profitability ratios with peers and forecast potential financial outcomes.
- Reddit Finance Community: Engage with other professionals to exchange insights and ask questions related to profitability analysis.
- LinkedIn Groups: Join groups that focus on financial analysis and business strategy to network and learn from peers, effectively using templates for financial modeling.
With these tools and resources, you can enhance your understanding and application of profitability ratios to improve financial health. Investing time in utilizing these resources will empower you to make well-informed strategic decisions, such as utilizing discount offers effectively.
FAQs
What are accounting ratios related to profitability?
Accounting ratios related to profitability include key metrics such as the gross profit margin, operating profit margin, net profit margin, return on assets (ROA), and return on equity (ROE). These ratios help evaluate a company’s ability to generate profit relative to revenue, assets, and equity. Each provides insights into different aspects of financial health.
What are the most commonly used profitability ratios?
The most commonly used profitability ratios are the gross profit margin, operating profit margin, net profit margin, return on assets (ROA), and return on equity (ROE). These ratios collectively provide a comprehensive picture of a company’s ability to generate profits from its operations and shareholder equity, making them valuable for analysis and comparison.
How do you calculate the net profit margin?
To calculate the net profit margin, divide the net profit by total revenue and multiply the result by 100. The formula is (Net Profit ÷ Revenue) × 100. This ratio indicates the percentage of revenue that translates into actual profit, reflecting the company’s overall financial effectiveness.
How can businesses improve their profitability ratios?
Businesses can improve their profitability ratios by optimizing operational efficiency, reducing costs, and increasing revenue streams. Strategies include streamlining processes, adopting cost-effective technologies, renegotiating supplier contracts, and enhancing pricing strategies. Additionally, effective marketing and improving customer experience can drive sales and boost profit margins. Furthermore, understanding the business valuation can help identify areas that need enhancement and exploring financing structures that align with business goals can provide new avenues for growth. A focus on liquidity current ratios can also prevent any cash flow issues that might arise from liabilities and ensure more stable operations.
How do profitability financial ratios help in business analysis?
Profitability financial ratios help in business analysis by providing insights into a company’s financial health and operational efficiency. They guide decision-making by indicating profit generation effectiveness relative to revenues and investments. These metrics are crucial during a business slowdown as they help assess whether profitability is sufficient to manage ongoing expenses. For instance, the Operating Profit Margin is vital for understanding a company’s capability to withstand economic downturns.
How is return on assets (ROA) calculated in profitability formula accounting?
Return on Assets (ROA) is calculated by dividing net income by total assets and then multiplying the result by 100 to express it as a percentage. The formula is (Net Income ÷ Total Assets) × 100. This ratio measures how efficiently a company utilizes its assets to produce profit, providing insight into asset use efficiency.