KEY TAKEAWAYS
- Indicator of Profitability: The net profit ratio is a critical measure of a company’s profitability, showing how well the company can convert its revenue into actual profit after accounting for all expenses. It reflects the company’s ability to control costs and set prices effectively.
- Used by Analysts and Investors: This ratio is extensively used by equity analysts and investors to assess the margin profile of a company. It indicates whether a company generates sufficient earnings to fuel its operations and reinvest in its growth.
- Caution in Analysis: While essential, the net profit ratio should not be the sole metric for analyzing a company’s financial health, as it can sometimes be skewed or inflated. It must be considered alongside other financial metrics to provide a holistic view of a company’s performance.
Decoding Net Profit Ratio
Understanding the Basics
Net Profit Ratio is a financial metric that measures the percentage of revenue that remains as profit after all expenses, taxes, and other costs have been deducted. It is calculated by dividing the net profit by the total sales revenue, usually expressed as a percentage. This ratio offers a quick snapshot of how efficiently a company is managing its resources and generating profits. Unlike gross profit ratio, which only subtracts the cost of goods sold (COGS) from revenue, net profit considers all operating expenses, interest, and taxes, thus providing a more comprehensive view of a company’s profitability. For any company considering a pricing strategy or looking to understand their true earnings potential, this ratio acts as a critical gauge. A robust net profit margin compared to competitors might also suggest strong product pricing power.
Importance in Financial Health Assessment
The Net Profit Ratio is indispensable for assessing a company’s financial health. It not only reveals how well a business transforms sales into actual profit but also reflects cost management effectiveness, operating expenditure, and operational efficiency. Moreover, it ties directly to return on equity, as a higher net profit ratio can enhance returns on the equity invested. This ratio aids stakeholders in gauging a company’s financial viability and its ability to generate sustainable earnings over time. Investors often use it to compare profitability levels against industry peers, such as retail companies, which can influence investment decisions. Additionally, a consistently high net profit ratio may indicate robust management, with efficient control over overhead costs, while a declining ratio might prompt a deeper analysis into operational shortcomings. Considering the marketplace dynamics, focusing on equity financing could improve valuations and equity ratios, thereby strengthening financial health further. Engaging with suppliers to negotiate better terms or pricing can also help in maximizing gross margin ratio and net profits.
Diving into Net Profit Margin
Difference Between Net Profit Ratio and Margin
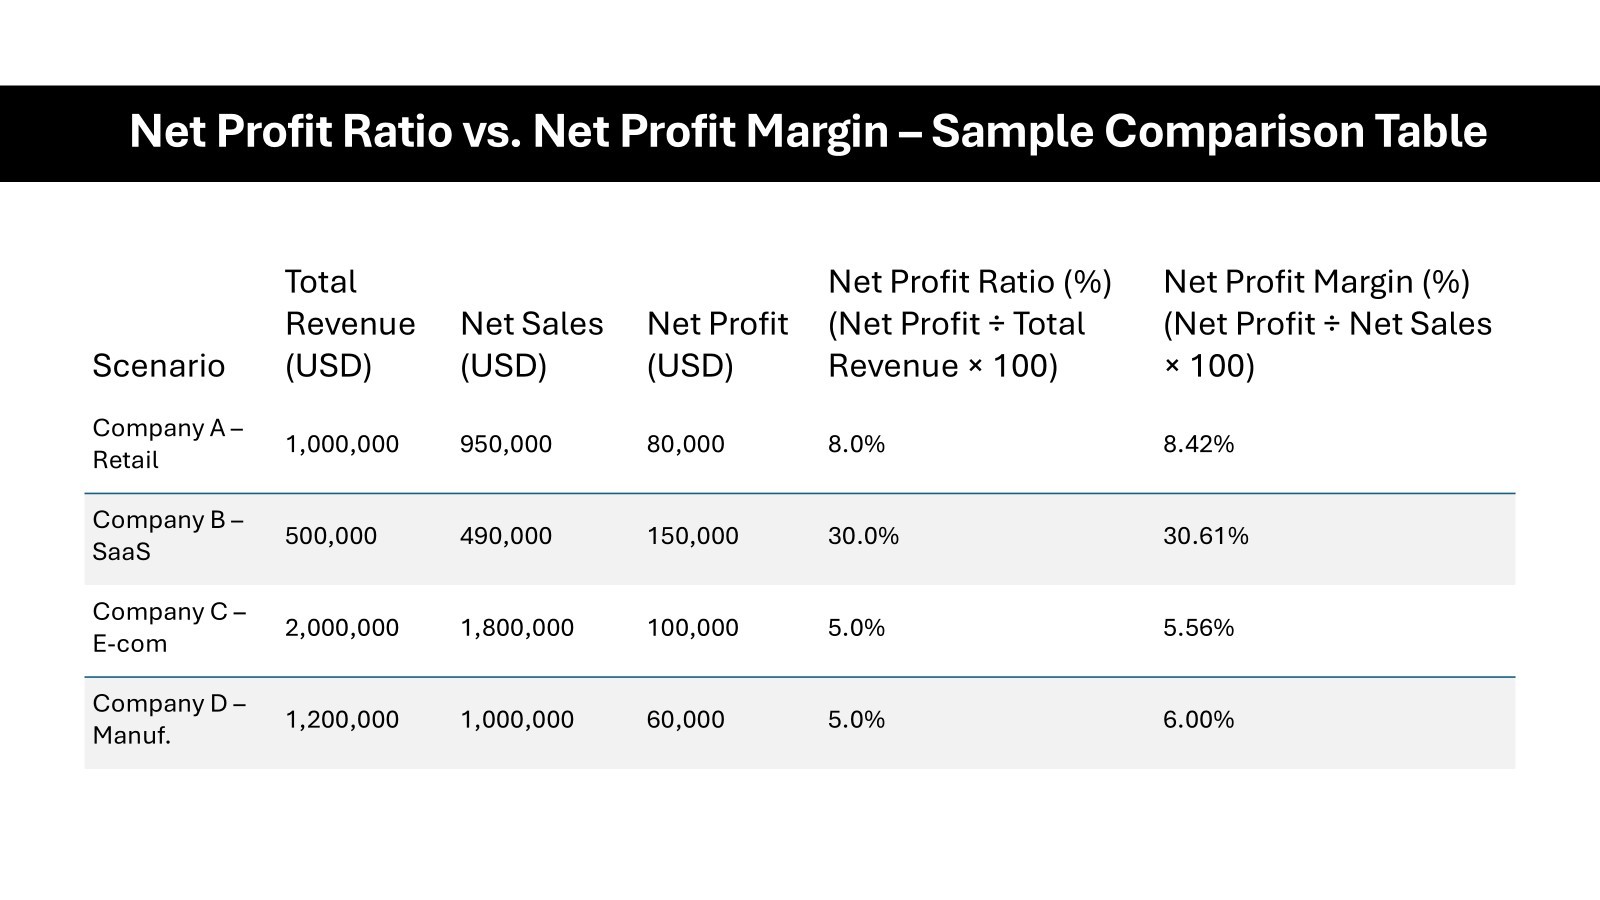
While the terms “Net Profit Ratio” and “Net Profit Margin” are often used interchangeably, they have distinct nuances. The Net Profit Ratio refers to the percentage of revenue that remains as profit after all expenses have been deducted. In contrast, Net Profit Margin is a measure of profitability presented as a percentage of net sales, demonstrating how much of each dollar earned translates to profit.
The key difference lies in their focus: the ratio is concerned with the relationship between net profit and total revenue, while the margin focuses on net sales and their profitability. Both metrics are crucial, but they offer different insights into financial performance.
Calculating the Net Profit Margin
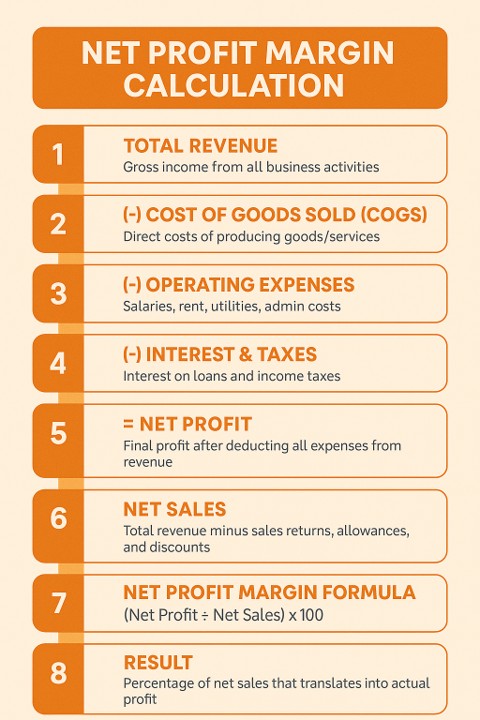
To calculate the Net Profit Margin, you’ll need to follow a straightforward formula: Net Profit Margin = (Net Profit / Net Sales) x 100. This simple yet powerful calculation reveals the percentage of each dollar of sales that represents profit, offering a clear view of profitability. To begin, determine the net profit by subtracting total expenses, including cost of goods sold, operating expenses, interest, and taxes, from total revenue.
Next, identify net sales, which is the total sales revenue minus any returns, allowances, or discounts. Finally, apply the formula, converting the resulting fraction into a percentage. This metric provides a concise snapshot of how effectively a company is converting sales into bottom-line profit.
Practical Calculations for Clarity
Step-by-Step Formula Breakdown
Breaking down the formula for calculating Net Profit Margin involves several clear steps. Here’s how you can calculate it methodically:
- Formula: Net Profit = Total Revenue – Total Expenses
- Formula: Net Profit Margin = (Net Profit / Net Sales) x 100
This step-by-step approach ensures you accurately capture the company’s profitability from its sales operations.
Real-World Example Explained
Imagine a company, TechGear, that has reported its financials for the fiscal year. TechGear’s total revenue is $500,000, and after accounting for discounts and returns, its net sales are $480,000. The total expenses, including the cost of goods sold, operating expenses, amortization, depreciation, taxes, and interest, are $420,000. These expenses may reflect strategic efforts toward automation, which can streamline operations and reduce long-term costs.
To find the Net Profit, subtract the total expenses from the net sales:
- Net Profit = $480,000 – $420,000 = $60,000
Next, apply the Net Profit Margin formula:
- Net Profit Margin = ($60,000 / $480,000) x 100 = 12.5%
This calculation shows that TechGear earns a profit of 12.5% for every dollar of sales, indicating efficient cost management and operational success. By analyzing the EBITDA margin, TechGear can further evaluate its operating performance before considering amortization and depreciation.
Strategic Importance of Net Profit Ratios
Insights from Trends Over Time
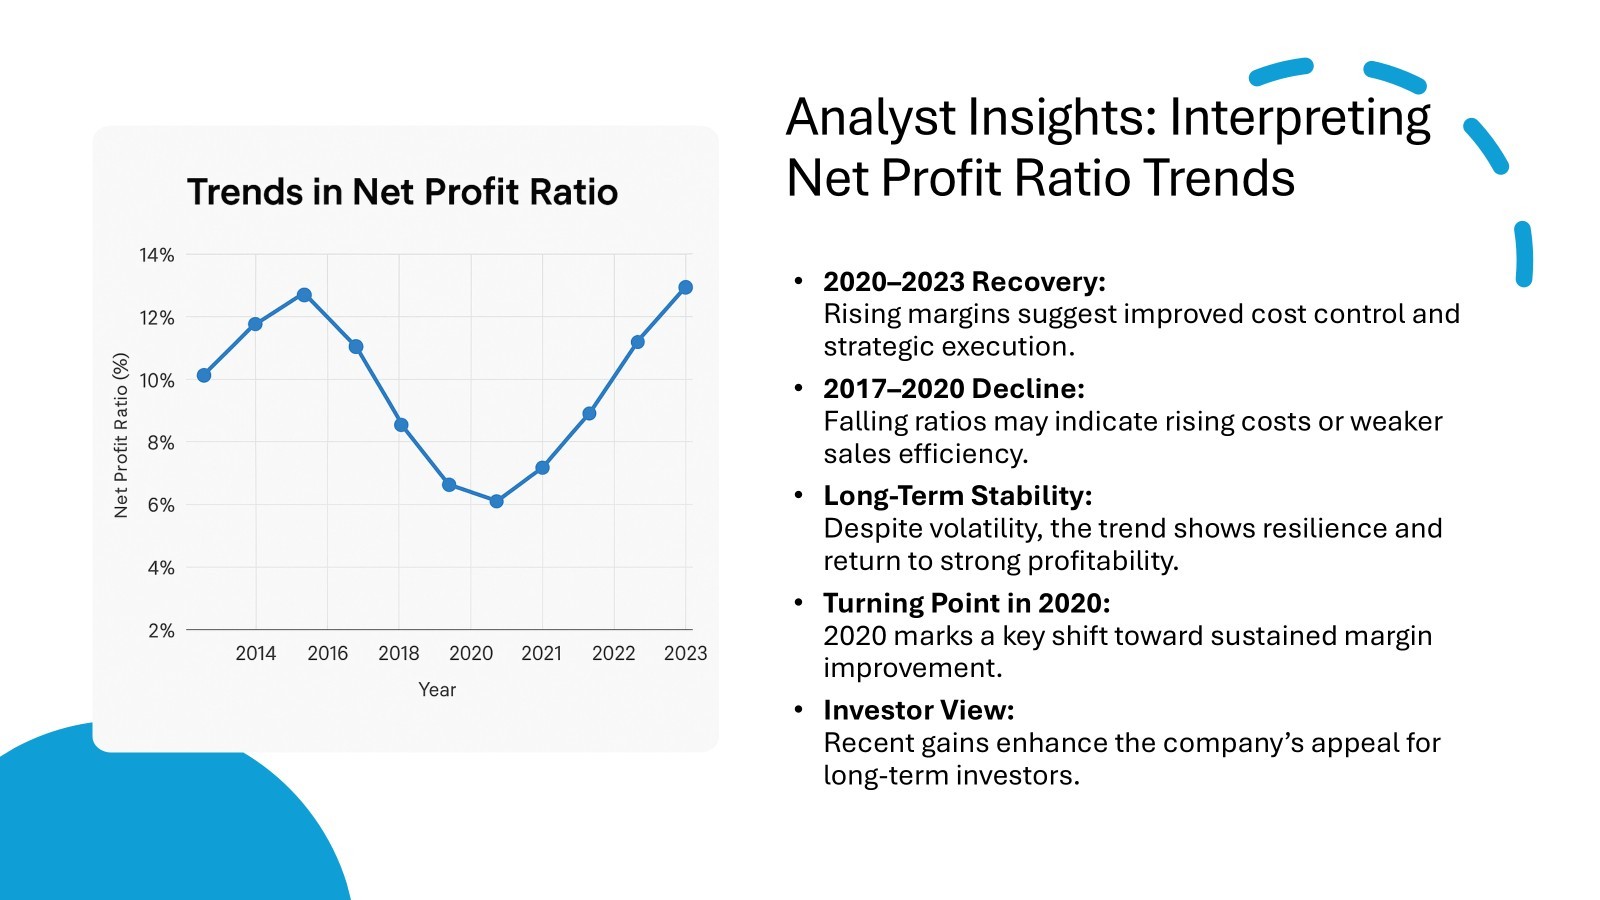
Trends in Net Profit Ratios over a period can provide significant insights into a company’s strategic positioning and overall financial trajectory. Analyzing these trends helps businesses spot patterns, whether improving, declining, or remaining stable. An upward trend could signal enhanced operational efficiency, cost reductions, or successful expansion strategies.
Conversely, a downward trend might highlight increasing costs or declining sales efficiency, prompting a need for strategic adjustments. By regularly monitoring these trends, companies can adapt to market changes and proactively manage financial health.
Comparing Across Industries
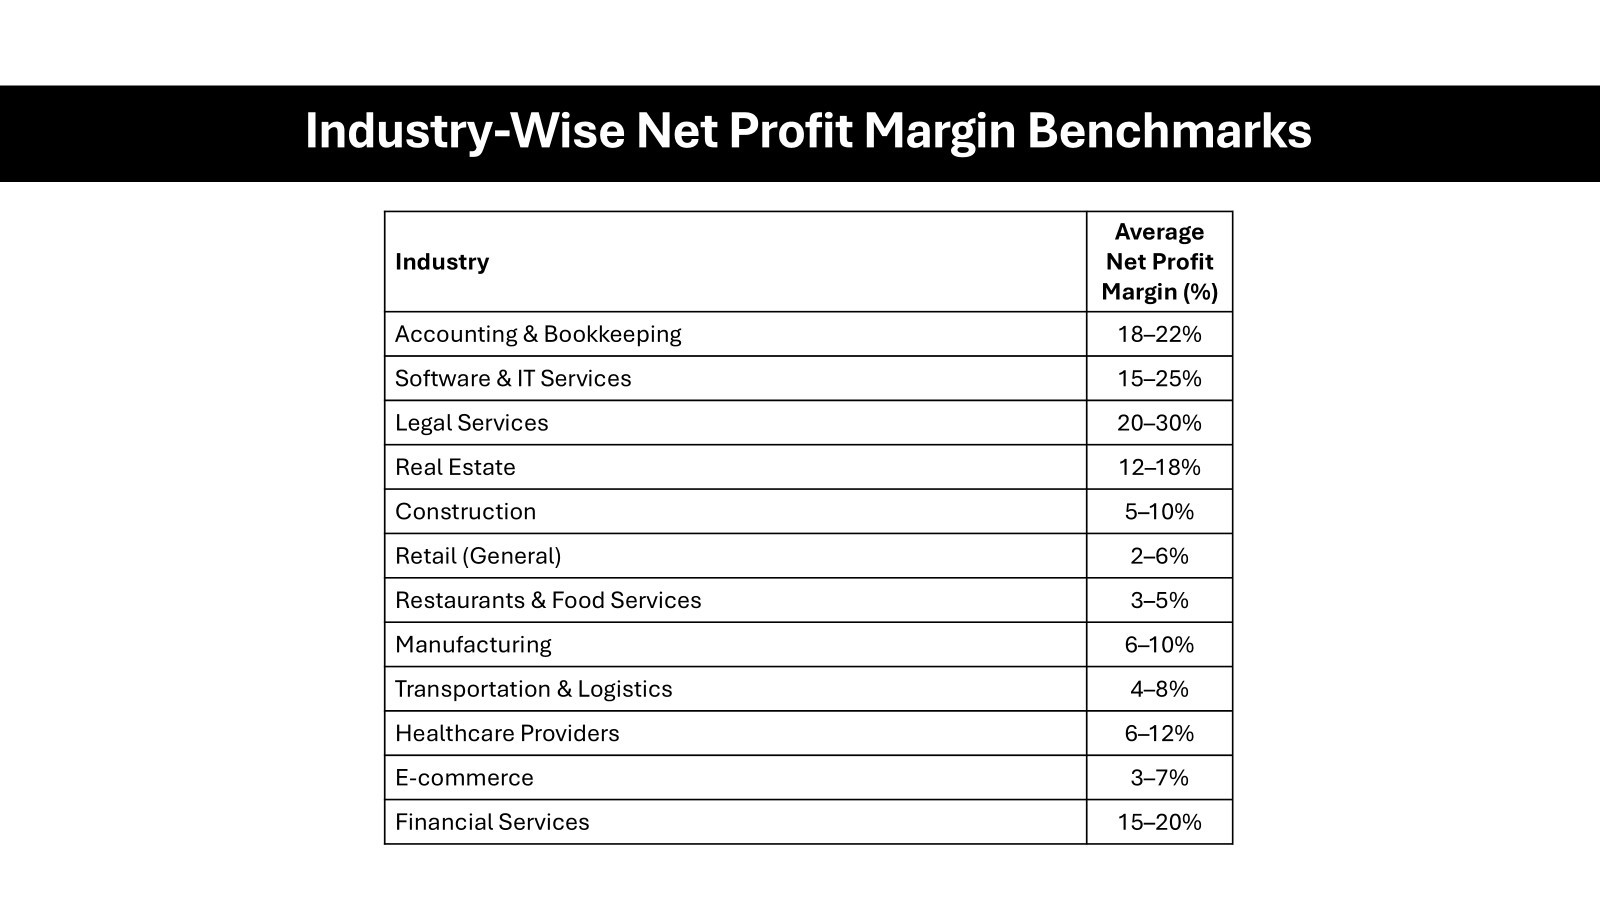
When comparing net profit ratios across industries, it’s crucial to recognize that standards and benchmarks vary significantly. For instance, industries like technology and pharmaceuticals often exhibit higher net profit margins due to fewer variable costs and innovation-driven value. In contrast, sectors such as retail and transportation might have lower margins because of higher operational expenses and competitive pricing pressures.
This variance highlights the importance of comparing a company’s net profit ratio only against peer companies within the same industry to obtain meaningful insights. Understanding these industry norms allows businesses to set realistic financial goals and strategies.
Utilizing for Business Growth
Leveraging net profit ratios for business growth involves strategic analysis and actionable insights. By assessing these ratios, businesses can identify areas where they excel and domains that demand improvement. Understanding net profit ratios enables companies to refine pricing strategies, optimize operational efficiencies, and control costs effectively, such as managing operating expenditure more efficiently or reducing overhead. Additionally, using a net profit ratio calculator can simplify this process and provide clearer insights into the company’s financial health. This metric also aids in assessing the potential of new market opportunities or investments, ensuring that growth efforts align with financial objectives. Retail companies, for example, can benefit by negotiating with their supplier for better payment terms or exploring savings in machinery costs, driving significant improvements in their gross margin ratio. By focusing on improving net profit ratios, companies can sustain growth, increase shareholder value, and maintain a competitive edge.
Potential Pitfalls and Considerations
Common Misinterpretations
Despite its widespread use, the net profit ratio can often be misinterpreted in several ways. One common misunderstanding is equating a high net profit ratio with business success without considering factors like market conditions or one-time events that could inflate figures. Additionally, comparing this ratio across vastly different industries can lead to erroneous conclusions about a company’s performance.
Another misstep is focusing solely on this ratio without considering other financial metrics that provide a comprehensive financial picture. These misinterpretations can lead to misguided business strategies if not carefully analyzed within the proper context.
Navigating Limitations and Drawbacks
While the net profit ratio is a vital financial metric, it’s important to acknowledge its limitations. This ratio provides a snapshot of profitability but doesn’t capture the nuances of economic cycles, market volatility, or seasonal fluctuations. It also doesn’t reflect cash flow aspects or future earning potentials, which can mask liquidity issues.
Another drawback is that it can be influenced by non-operating incomes and expenses, which do not reflect core business performance. Businesses should use it alongside other indicators, such as the cash flow statement and balance sheet, to make holistic financial assessments.
FAQs
What is net income margin and how is it interpreted?
Net income margin is the percentage of revenue left as profit after all expenses, including taxes and interest, are deducted. It’s interpreted as a reflection of how effectively a company converts sales into actual profit, indicating financial health. A higher margin suggests efficient cost management and strong profitability, while a lower margin might highlight areas needing improvement.
How do you calculate net profit margin?
To calculate net profit margin, divide the net profit by net sales and then multiply by 100. The formula is: Net Profit Margin = (Net Profit / Net Sales) x 100. This metric shows the percentage of each sales dollar that turns into profit, offering a clear measure of profitability efficiency.
Why is net profit ratio significant for businesses?
The net profit ratio is significant because it provides insight into a company’s overall profitability and cost management efficiency. It helps businesses understand the profit amount retained from total revenue after all expenses. This ratio is crucial for strategic decision-making, investor assessments, and identifying areas for operational improvement.
What are the limitations of using net profit margin?
Net profit margin has limitations such as not accounting for cash flow and being influenced by non-operating figures, which can distort core operational performance. It also ignores industry-specific variations and economic conditions. Relying solely on this metric can lead to misinformed conclusions without considering the broader financial context.
What is the formula to calculate net income margin using revenue?
The formula to calculate net income margin using revenue is: Net Income Margin = (Net Income / Total Revenue) x 100. This calculation expresses the percentage of total revenue that remains as net income after all expenses are deducted, offering insights into profitability and efficiency.