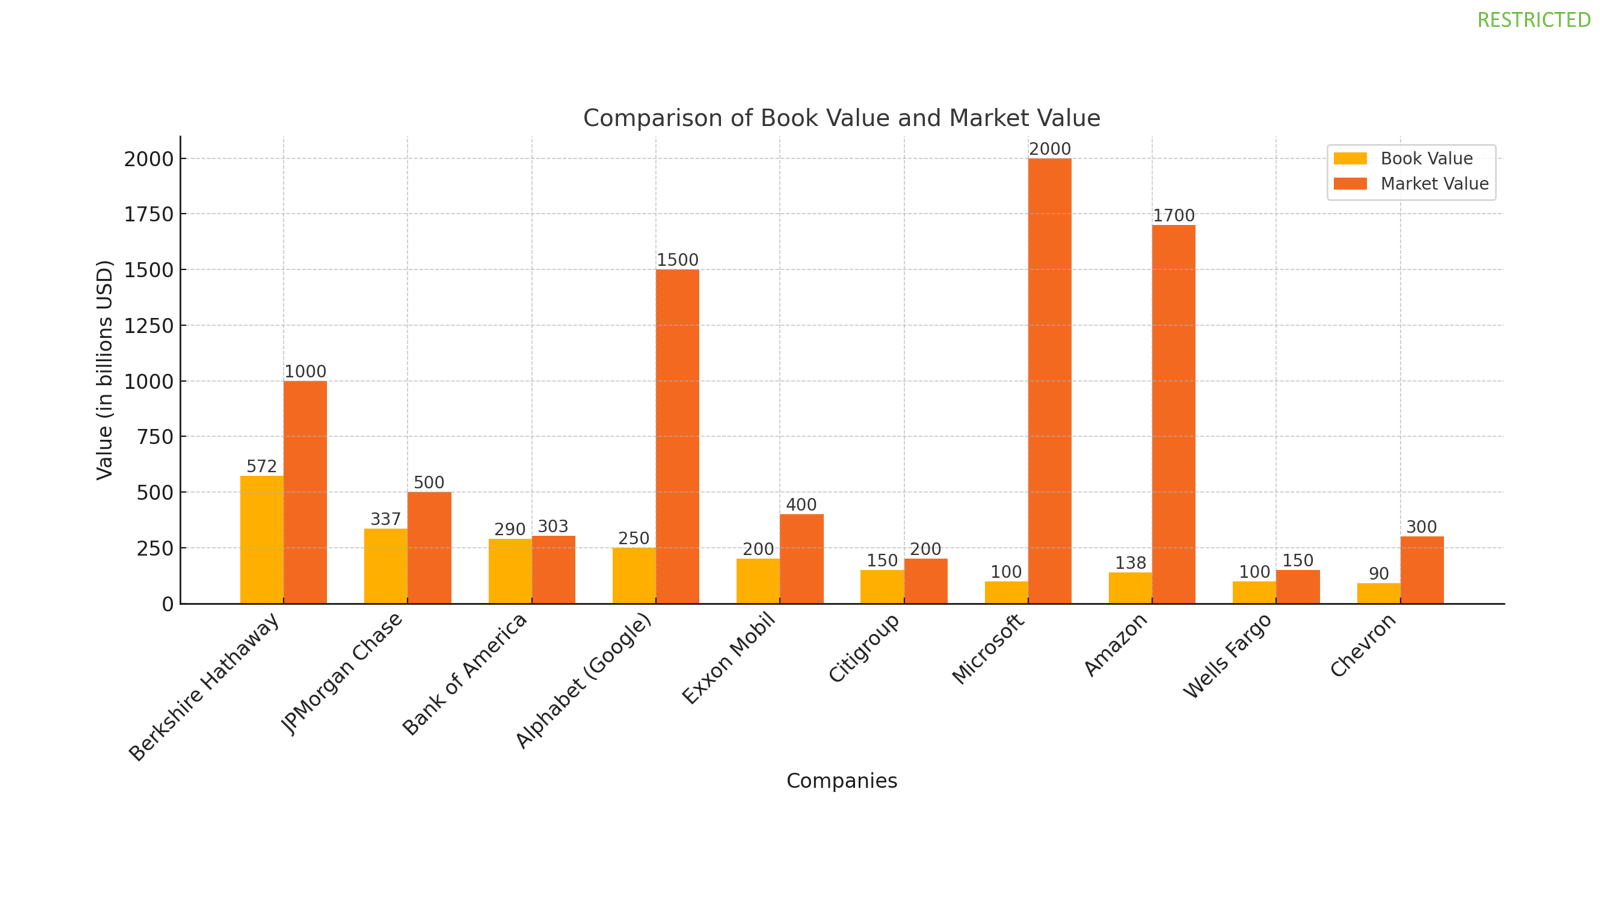
When investors weigh the potential of a stock, they often look to the market to book ratio for a clear signal of how highly the market values the company as compared to its book value – essentially what the company is intrinsically worth on paper. It operates as a comparison shopper’s guide for investors, providing a baseline to determine whether they’re getting a bargain or overpaying for a slice of ownership in the company.
The Significance of Market to Book in Financial Analysis
The market to book ratio is more than just a number—it’s a flashlight in the financial analysis toolkit that illuminates how the market perceives a company’s economic narrative versus the story told by its actual net assets. Analysts and savvy investors prowl through a company’s financial jungle with this metric to sniff out opportunities for value investments or identify stocks that might not be as promising as they appear.
By contrasting a company’s market cap with its book value, this ratio sheds light on how investors reward efficiency, innovation, and potential growth, as these factors often drive a stock’s market price above or beyond its book value. It’s particularly significant when discrepancies between these values spark curiosity—why is a company with solid assets undervalued or why is another with lesser assets overvalued? The market to book ratio serves as a starting point for such investigations.
With this metric, one can draw a bead on how much they would be paying for what a company is fundamentally worth, and this insight is invaluable when drawing battle lines for portfolio dominance in the competitive world of investment.
KEY TAKEAWAYS
- The market-to-book ratio is a financial metric that compares a company’s market value, represented by its current stock price multiplied by outstanding shares, to its book value, which is the value of all its assets minus liabilities as recorded on its balance sheet. A high ratio could indicate that the company is overvalued, whereas a low ratio may imply it is undervalued, although interpretations can vary based on industry and other contextual factors.
- It is critical to understand that using the market-to-book ratio alone to evaluate a company’s financial health or investment potential can be misleading. Analysts and investors should consider other factors such as the company’s business model, industry trends, growth prospects, and economic conditions alongside the market-to-book ratio to get a comprehensive picture.
- The book-to-market ratio, which is the inverse of the market-to-book ratio, can also serve as a tool for investment analysis. A book-to-market ratio greater than 1 could point to an undervalued stock, whereas a ratio less than 1 might suggest that the stock is overvalued. This ratio is useful for investors looking to make informed decisions on whether to buy or avoid certain stocks based on the company’s relative market valuation.
Breaking Down the Formula
Components of the Market to Book Ratio
Diving into the depths of the market to book ratio, you’re bound to encounter two main components that serve as its foundation: market capitalization and book value.
Market Capitalization: Picture this as the grand total of a company’s stock value, equal to the current share price times the total number of outstanding shares. It’s the market’s current vote on the company’s value—a dynamic number that dances to the rhythm of the stock market’s heartbeat.
Book Value: In contrast, the book value is like the historical cost ledger of the company, minus any liabilities. It’s the accountant’s snapshot of a company’s net worth, taken from the balance sheet, providing a figure that is usually more stable over time. It’s the treasure minus the debts, the sum of all assets if a company were to liquidate everything it owns and settle all it owes.
Together, these two essential elements form the yin and yang of the market to book ratio, each telling its part of the story about a company’s worth.
Step-by-Step Calculation
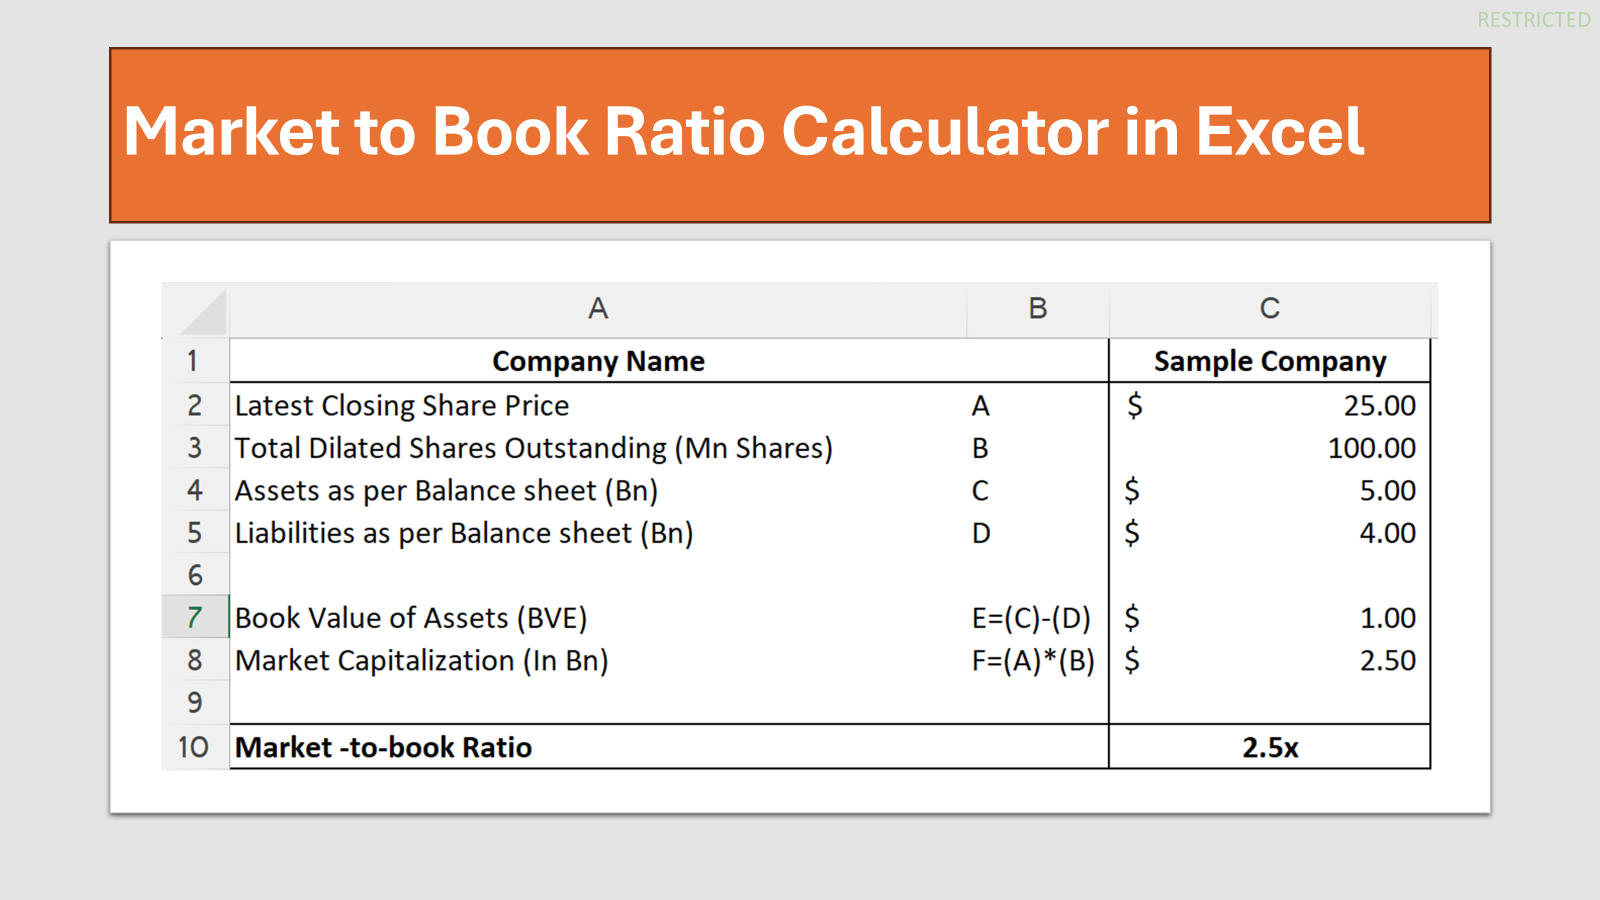
Calculating the market to book ratio is like following a simple recipe—it’s straightforward if you have all the ingredients on hand. Let’s cook up an example with the following shared assumptions:
- Latest Closing Share Price: Imagine the last recorded share price for the company’s stock is $25.00.
- Total Dilated Shares Outstanding: Think of this as the sum of all shares currently owned by shareholders, e.g., 100 million shares.
Firstly, whip up the market capitalization like this: Market Capitalization = Share Price × Shares Outstanding So, Market Capitalization = $25.00 × 100 million = $2.5 billion.
Now, to prepare the book value, you’ll need:
- Assets: Let’s use $5 billion as our example number.
- Liabilities: Here, consider $4 billion for our calculation.
Next, extract the book value of equity (BVE) by subtracting liabilities from assets: BVE = Assets – Liabilities Therefore, BVE = $5 billion – $4 billion = $1 billion.
For the final flourish, combine these elements to unveil the market to book ratio: Market to Book Ratio = Market Capitalization ÷ BVE Hence, Market to Book Ratio = $2.5 billion ÷ $1 billion = 2.5x.
And voilà! You have a tasty market to book ratio, ready to serve. It’s really as simple as measuring out the ingredients and following the steps.
Insights from Market to Book Ratios
What a High or Low Ratio Indicates
A high or low market to book ratio can whisper clues about a company’s valuation story, sometimes hinting at a plot twist yet to be understood by the market audience.
High Ratio (Greater than 1): When you encounter a ratio soaring above 1, it reveals that investors are willing to pay more than the company’s net worth. It’s often a badge of market optimism, suggesting that the company has auspicious growth prospects or possesses intangible assets like brand strength, cutting-edge technology, or industry dominance.
But hold on to your hats—while a high ratio might signal expectations of future success, it can sometimes also wave a warning flag of overvaluation, urging a deeper look into whether the price is justified by potential earnings.
Low Ratio (Less than 1): On the flip side, a ratio that dips below 1 indicates that the company’s stock is priced less than the value of its assets. This could either scream ‘bargain deal’ to value investors or whisper ‘red flag’, signifying possible underlying issues or a lack of investor confidence.
It’s a thriller narrative where a low ratio could be seen as an undervalued investment opportunity waiting to be seized or as a cautionary tale urging a meticulous dissection of the company’s health and market position.
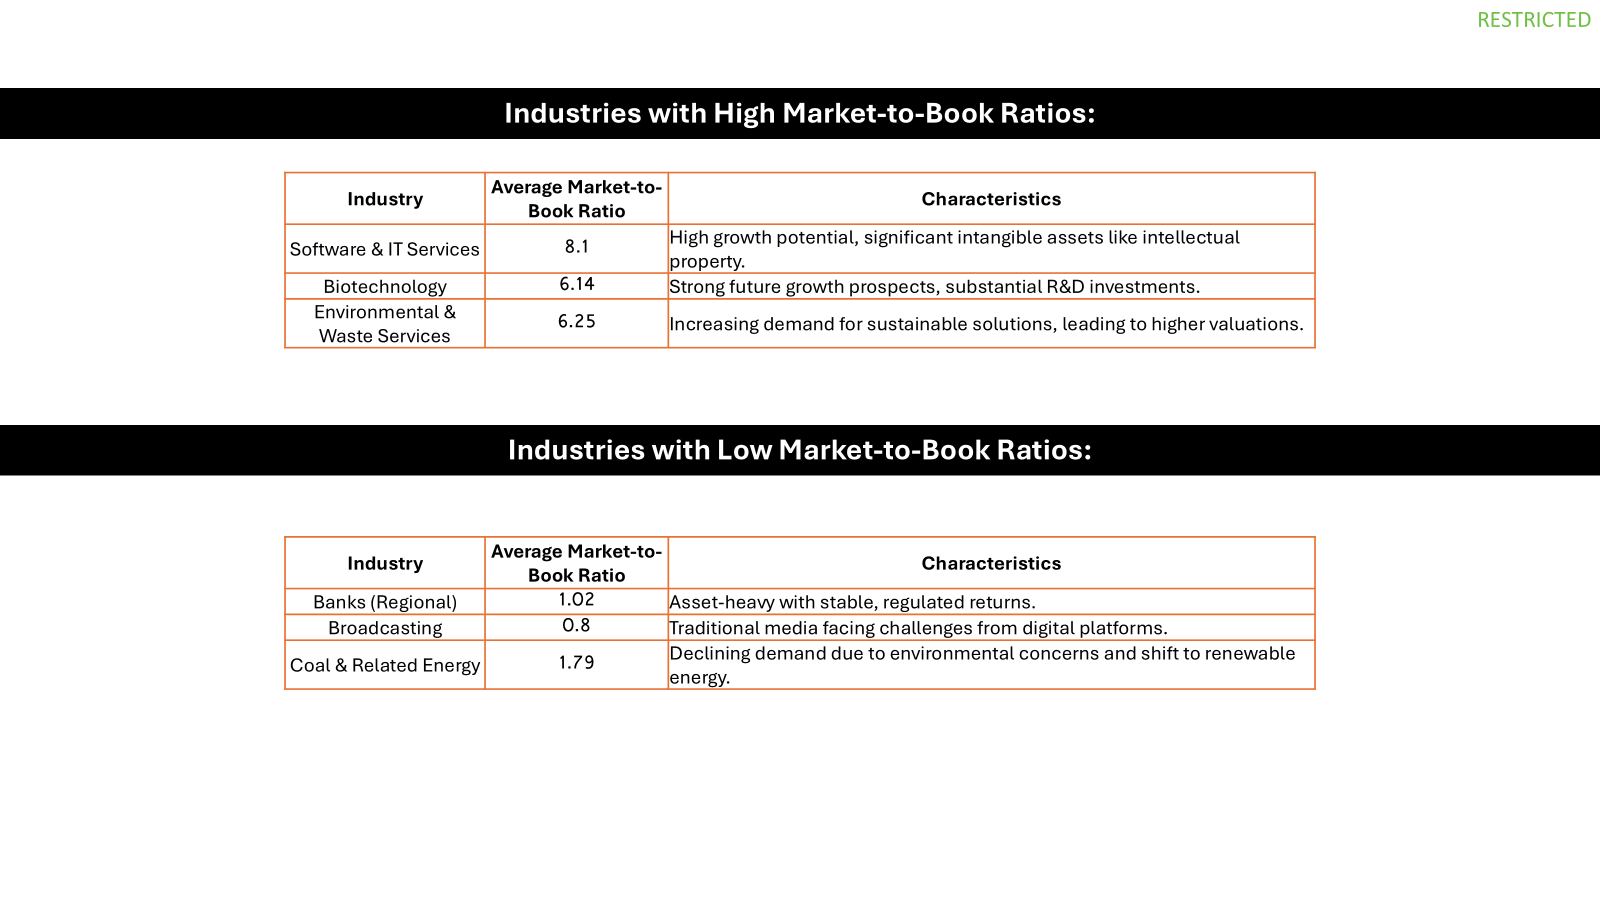
Interpretation Across Different Industries
When you’re navigating the market landscape, using the market to book ratio as a compass can have different implications across the diverse terrain of industries.
For example, in sectors like technology or pharmaceuticals where future earnings potential and intangible assets carry hefty weight, a higher market to book ratio is common and often accepted as the norm. This reflects a market willingness to place a premium on companies that invest heavily in R&D and innovation, which may not be immediately evident on a balance sheet.
In contrast, more traditional industries such as manufacturing or utilities might exhibit lower market to book ratios. This could be telling of a focus on tangible assets and a business model grounded in concrete assets like plants and machinery, which the book value captures more directly.
It’s crucial to understand that the ‘book’ looks at the past while the ‘market’ gazes into the future, so the ratio in each industry reflects the balance between these two perspectives and how they value assets and growth opportunities.
When you size up companies across different sectors, keep in mind how industry norms can color the interpretation of their market to book ratios. It’s like they’re singing different genres of music—one might be belting out optimistic future tunes while another hums a more asset-concrete melody.
Practical Uses of Market to Book Ratio
Enhancing Investment Decisions
When you’re fishing for the best stocks to grow your portfolio, using the market to book ratio as bait can sometimes help you catch a whopper. It’s a tool that can polish the lens through which you view potential investments, offering clarity on whether you might be casting your line for a company at a fair market price or getting snagged on the rocks of overvaluation.
Savvy investors often wield the market to book ratio to sift for value stocks—those unpolished gems trading at a price less than their book value, potentially due to investor oversight or short-term market conditions. It can be a signal, like a lighthouse guiding ships, indicating a stock might be undervalued and poised for a profitable course correction once the market adjusts its sails.
Alternatively, for those eyeing stocks as growth investments, a higher market to book value could suggest that other investors are also betting big on a company’s future earnings and market presence. It’s a high-stakes game where discerning the difference between a justified premium and an overinflated price is vital.
Remember, in the art of investment decision-making, the market to book ratio isn’t a crystal ball but rather one piece of the puzzle. It’s best used in concert with other financial analysis tools to ensure a 360-degree view of a company’s potential.
Comparing Company Valuations
In the bustling marketplace of stocks, using the market to book ratio for comparing company valuations is akin to bringing a measuring tape to a hall of fame — it helps you gauge who truly stands tall. This financial metric streamlines cross-comparison by distilling down to a single figure, giving you a side-by-side look at different companies as if they were competitors in a valuation race.
Investors can align companies from the same industry on the starting block and see how their market to book ratios fare against one another. A lower ratio might suggest a potentially undervalued company lying in wait for its day in the sun, or it could indicate one that’s lagging behind due to fundamental issues. On the other end of the spectrum, a higher ratio could signal a leader that’s bursting through industry expectations or a cautionary tale of overvaluation waiting to unfold.
Comparing valuations with this ratio, investors can spot patterns, discern industry trends, and make more informed choices about where to place their bets. It’s a lens to discern market favor, reputation, and anticipated performance. However, always approach with the keen understanding that the market to book ratio is just one piece of the valuing jigsaw puzzle.
Common Misconceptions and Limitations
Exploring Potential Pitfalls
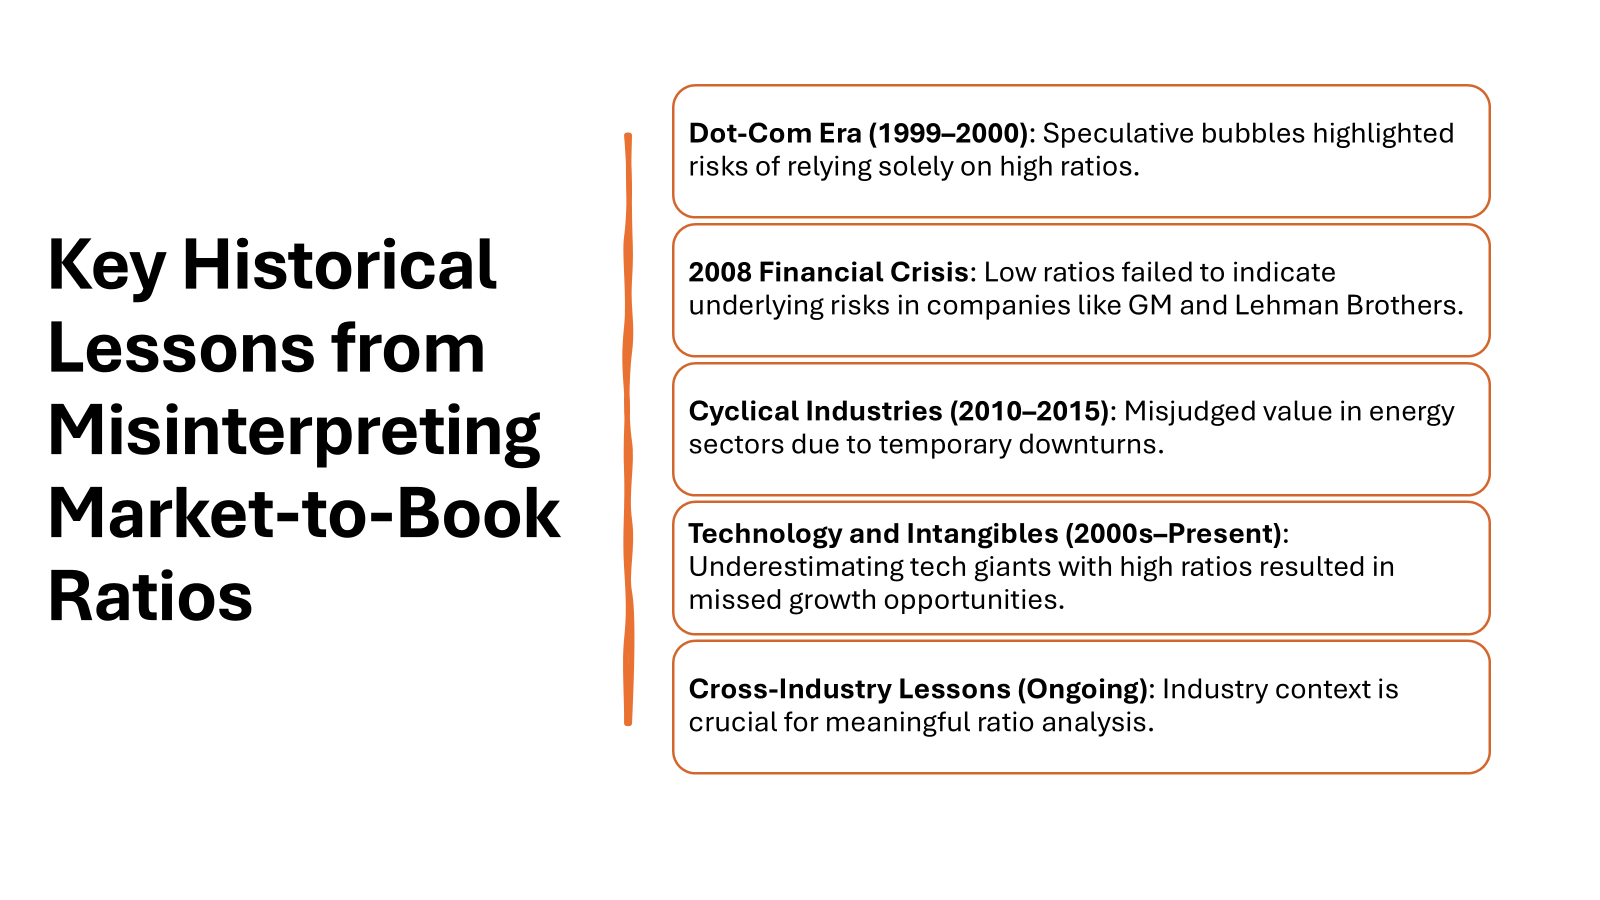
While the market to book ratio can shine a spotlight on valuable insights, navigating its use without caution is like walking a tightrope without a safety net — there are potential pitfalls that could sway your analysis off balance. One such trap is the illusion of value; a low market to book ratio could attract you with whispers of an undervalued stock, but it’s essential to dig deeper to ensure that it’s not a siren song of a company with inherent problems or declining prospects.
Investors should be alert to the fact that book value may not always reflect the true value of a company’s assets, particularly with intangible assets or rapidly changing industries where traditional accounting falls short. The ratio also assumes that the company’s assets can be liquidated at their book value, which isn’t always the case, especially during economic downturns when asset values can plummet.
Therefore, while the ratio is a nifty tool, always wield it alongside a diverse arsenal of analytical instruments to avoid potential pitfalls and steer clear of false leads on the path to investment success.
Contextualizing the Ratio’s Application
To wield the market to book ratio effectively in the financial realm, understanding its context is as crucial as a map is to a treasure hunter. This ratio is not just a stand-alone figure but an indicator whose significance is often tied to the economic environment, sector-specific dynamics, and the individual characteristics of a company.
For instance, consider the context of the industry life cycle; a burgeoning tech start-up may naturally sport a higher market to book ratio due to its growth potential, while a seasoned manufacturing firm could have a modest ratio reflective of its steady, tangible asset base. Likewise, during market upswings where optimism rules, even average companies might flaunt inflated ratios, whereas during a downturn, even sturdy enterprises might seem undervalued.
Combining the market to book ratio with your understanding of broader economic indicators, sectoral shifts, and corporate fundamentals adds depth to your analysis. It’s not just about what the ratio is, but why it is so, and the answer to that lies in the rich context of each unique scenario.
Real-World Examples
Analyzing Tech Industry Dynamics
The tech industry, with its breakneck pace and innovation-driven ethos, often defies conventional financial metrics, making the market to book ratio analysis here particularly intriguing. Many tech companies, especially those focused on software or digital services, may carry hefty market to book ratios, signifying the value investors place on their future growth prospects, intellectual property, and potential disruptions to established markets.
Yet these high ratios also necessitate a balance of enthusiasm with scrutiny, as tech industry companies could be prone to speculative bubbles, where investor excitement far outpaces the company’s actual financial grounding. When you analyze tech companies, factor in the rate of technological change, competitive positioning, and the company’s roadmap for future products and services, as these elements can heavily influence the narrative behind a high market to book ratio.
Remember, tech industry dynamics often require looking beyond the numbers to the stories of innovation and strategic vision that truly drive investor sentiment in this sector.
The Market to Book Ratio is a crucial metric used in business valuation. This ratio is often employed by both individual investors and investment banking professionals to assess a company’s market value relative to its book value. The calculation involves dividing the market price per share by the book value per share, providing an inverse measure of how adequately a company is leveraging its assets for growth. Investors closely monitor this ratio as it can indicate speculative trends in the market, often influencing profit projections for potential listings.
Its usage extends beyond simple evaluation, encompassing factors like patents and other intellectual property that might not be reflected on the balance sheet. Investor speculation can drive the ratio higher, particularly when investors believe future growth is not fully captured in the current book value. Conversely, the ratio may be lower for established companies where patents and assets have been thoroughly stated on the books. By interpreting the Market to Book Ratio alongside a company’s business strategy and industry position, investors can make informed decisions, leveraging this information as a summary insight into potential investment opportunities.
Market to Book in Mergers and Acquisitions
The stage of mergers and acquisitions (M&A) is where the market to book ratio takes on a critical role, offering insights that could make or break multi-billion-dollar deals. In the M&A dance, a target company’s market to book ratio helps acquirers spot potential deals — a low ratio may signal an undervalued company ripe for the picking, or, conversely, a high ratio might identify a premium enterprise expected to add significant future value.
However, acquirers beware — it’s paramount to analyze whether the ratio truly reflects the synergies and efficiencies the acquisition is expected to bring. Overpaying for a high market to book value could lead to a challenging integration if the anticipated growth doesn’t materialize as hoped. Hence, meticulous due diligence is non-negotiable to ascertain the compatibility of the deal with strategic objectives.
In the M&A realm, this ratio is one piece of the valuation puzzle, blending with other financial and non-financial assessments to craft a comprehensive picture of the potential merger or acquisition.
Frequently Asked Questions (FAQ)
How is the market to book ratio different from the price to earnings (P/E) ratio?
The market to book ratio compares a company’s market capitalization with its book value, offering insights into how the market values the company against its recorded net assets. In contrast, the price to earnings (P/E) ratio measures a company’s current share price relative to its per-share earnings, shining a light on valuation through the lens of profitability. While the market to book ratio focuses on assets minus liabilities, the P/E ratio emphasizes earnings and future potential, making them complementary tools in your investment toolbox.
Can the market to book ratio predict company performance?
The market to book ratio, while a useful indicator of how the market values a company’s net assets, isn’t a crystal ball for predicting company performance. It can hint at over- or undervaluation, but it doesn’t directly account for future earnings, market conditions, or management decisions. For a well-rounded forecast, complement it with other financial metrics and qualitative analysis.
What are alternative valuation ratios akin to market to book?
Beyond the market to book ratio, several other valuation ratios offer different perspectives on a company’s worth. Price to earnings (P/E) ratio examines price relative to earnings, while price to sales (P/S) looks at price compared to revenue, offering a view untainted by accounting policies. The enterprise value to EBITDA (EV/EBITDA) ratio considers a company’s value in terms of earnings before interest, taxes, depreciation, and amortization, often used for comparing firms with varying capital structures. Each ratio brings its unique flavor to the valuation feast, enriching investment analyses.


