KEY TAKEAWAYS
- Formula Differences: While both gross and net margin are expressed as percentages and reflect profitability, gross margin has a simpler formula focused on revenue minus the cost of goods sold (COGS). In contrast, net margin considers a broader array of expenses, including taxes, rent, and depreciation, subtracted from total revenue.
- Relevance to Financial Assessment: Regularly calculating and tracking both gross and net margins is essential for assessing the financial health and sustainability of a business. These metrics act as a “profitability report card,” providing insights into how effectively a company converts revenues into profit at various stages of growth.
- Significant Variance in Outcomes: Gross and net margins can differ substantially. For example, in 2018, a company had a gross margin of 62% but a significantly lower net margin of 14.8%, highlighting the impact of comprehensive business expenses on profitability.
Breaking Down Profit Margins
What is Gross Profit Margin?
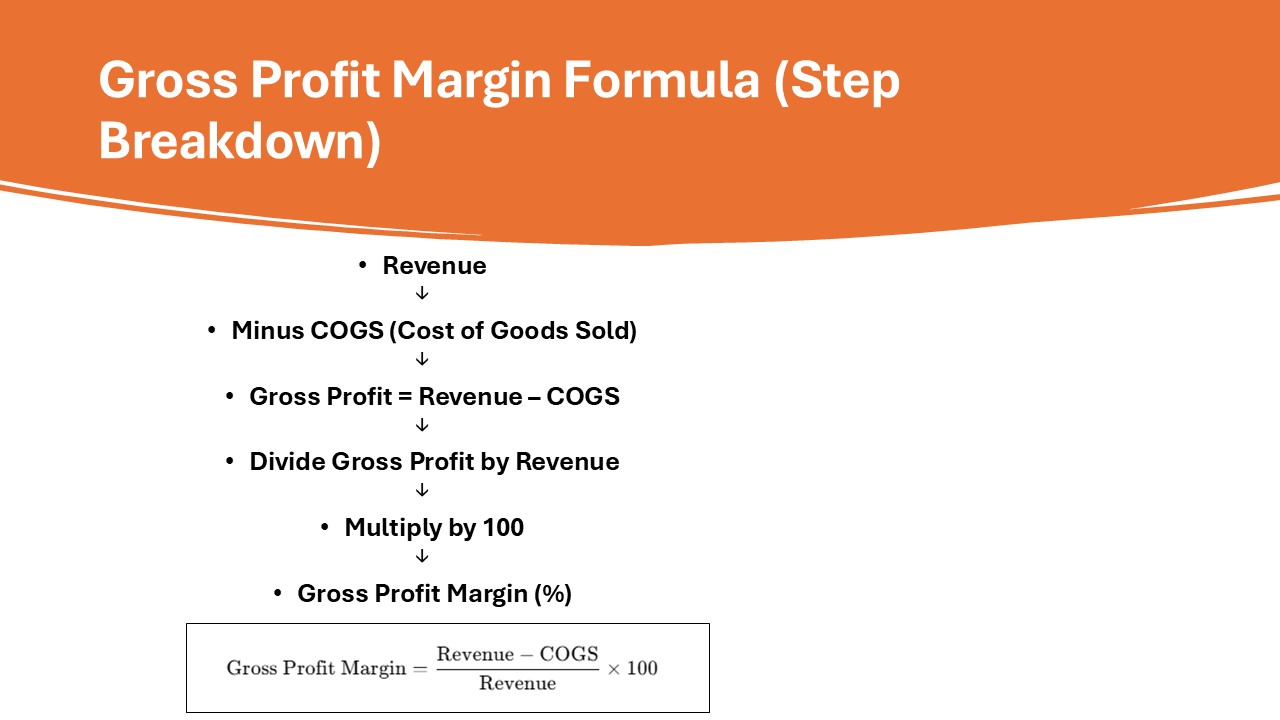
Gross profit margin refers to the percentage of revenue that exceeds the cost of goods sold (COGS). This profitability indicator provides insight into how effectively a company produces and sells its products. To calculate it, you use the gross margin formula: divide the gross profit (revenue minus COGS) by the total revenue, then multiply by 100. A higher gross profit margin indicates efficient production and strong pricing strategies, which can ultimately enhance profit metrics and business valuation.
What is Net Profit Margin?
Net profit margin is the percentage of revenue left after all expenses, including operating costs, interest, taxes, and preferred stock dividends, have been deducted. It serves as a comprehensive measure of a company’s profitability, considering factors such as depreciation, overhead costs, and rent. To calculate net profit margin, you subtract total expenses from revenue and divide the result by the total revenue, then multiply by 100. A higher net profit margin indicates greater efficiency in managing overall expenses relative to earnings. In addition to this, tracking profit margin metrics like EBITDA and EBIT gives further insight into business operations, by excluding interest and taxes to present a clearer view of operating efficiency.
Key Differences Explained
Components of Gross vs. Net
The components of gross and net profit margins differ primarily in their scope. Gross profit margin focuses on the difference between sales and the direct costs associated with producing goods and services. Its components include revenue and the cost of goods sold (COGS). This is critical for business valuation as it indicates how efficiently a company manages its production and inventory. In contrast, net profit margin takes a broader view, encompassing gross profit while also accounting for operating expenses, interest, taxes, and other non-operating costs. This margin includes all revenue streams and considers the total expenses incurred by the business, and it is crucial for evaluating the company’s overall financial health, often checked by investment banking analysts. Understanding these components helps in accurately interpreting each profit margin’s implications.
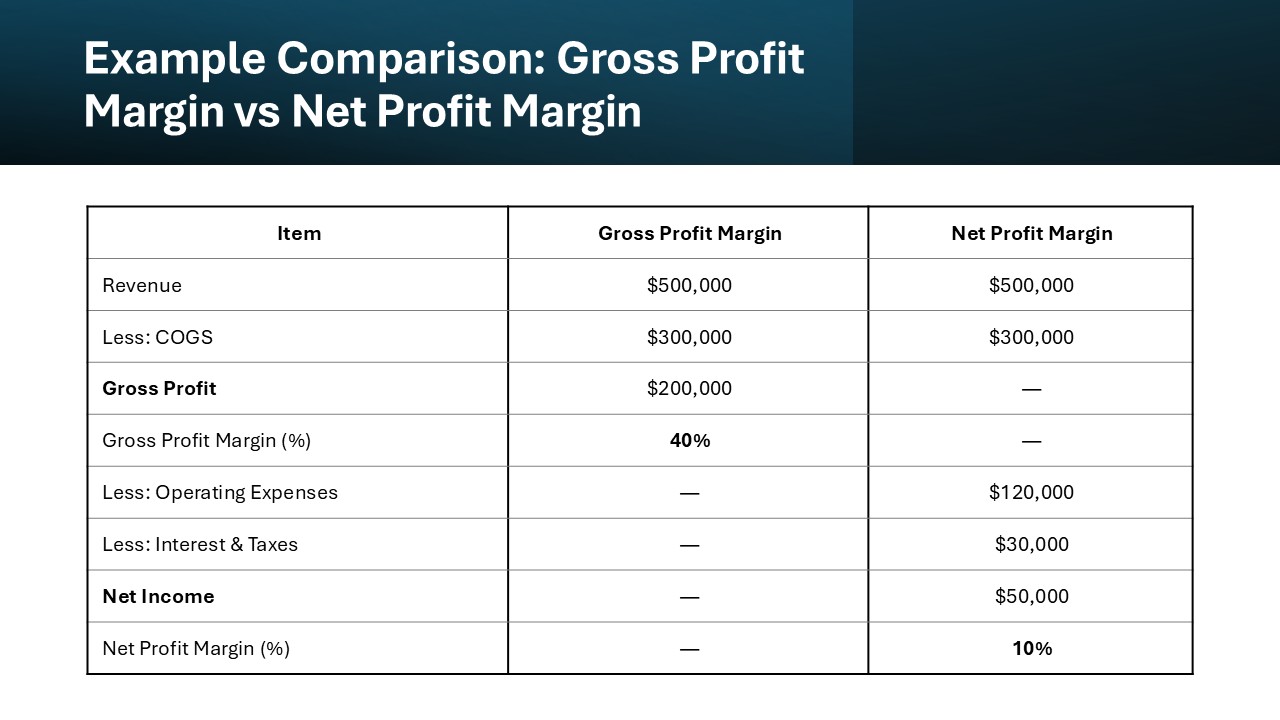
Calculation Methods Compared
When comparing the calculation methods between gross and net profit margins, the approaches reveal their differing focuses.
- Gross Profit Margin Calculation:
- Formula: (Revenue – Cost of Goods Sold) / Revenue x 100
- This method evaluates the efficiency of production and pricing strategies, focusing primarily on direct costs related to the creation of goods and services.
- Net Profit Margin Calculation:
- Formula: (Net Income / Revenue) x 100
- This involves taking the net income, which includes all total income after deducting operating expenses, interest, taxes, and any other costs. This method provides a complete picture of overall profitability.
Both calculations are vital to assess different aspects of a company’s financial performance, helping identify areas of strength and potential improvement.
Real-World Examples
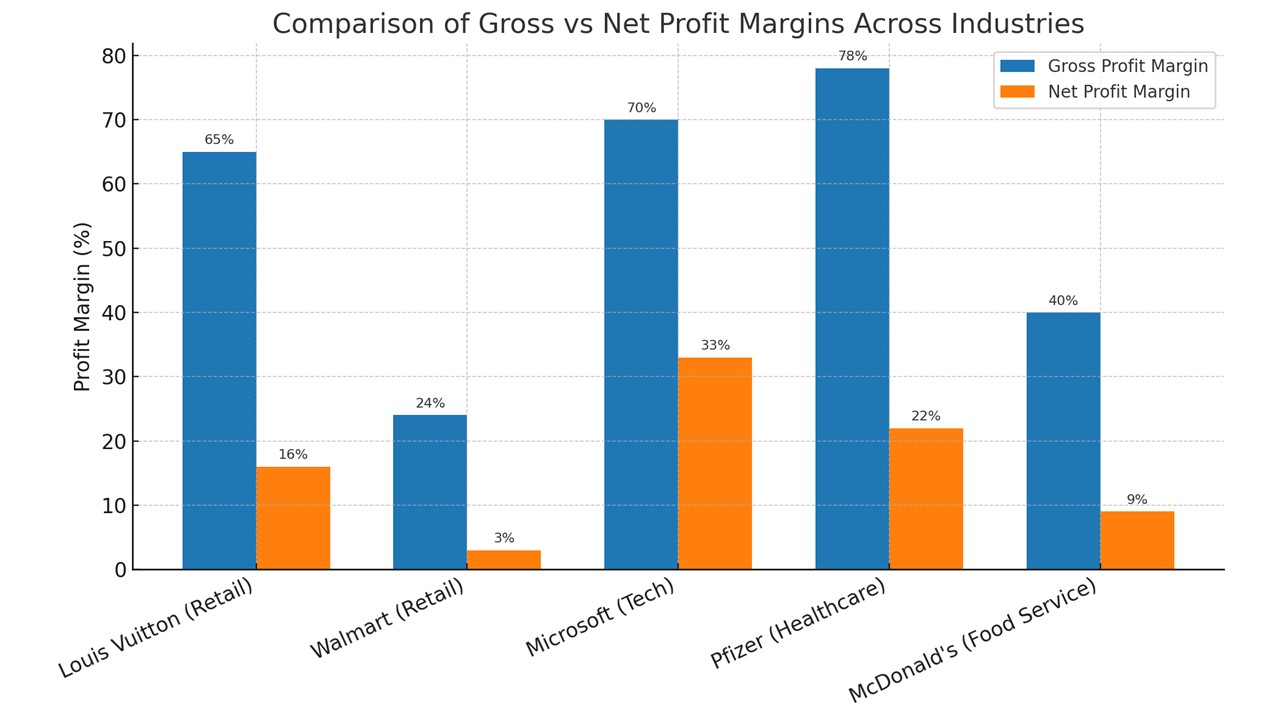
Exploring real-world examples of gross and net profit margins can illuminate how different industries and businesses operate. For instance, consider a luxury fashion retailer with a gross profit margin of 60%. This suggests efficient production and significant pricing power. However, their net profit margin is only 12%, reflecting high operating expenses typical in retail, like marketing and store maintenance. Each dollar of sales is subject to these costs, impacting the overall profitability indicator.
Contrast this with a software company, which might have a gross profit margin of 80% due to minimal COGS and a net profit margin of 25%, thanks to lower operational costs. This illustrates that every dollar of revenue is efficiently converted into profit, ensuring a strong profitability indicator. Such examples highlight industry-specific dynamics and underscore the necessity of analyzing both margins for a deeper understanding of financial health.
Importance of Understanding Margins
Impact on Business Decisions
Understanding gross and net profit margins profoundly influences business decisions. These metrics guide pricing strategies, cost management, and investment choices. A high gross margin might suggest effective production, prompting businesses to focus on volume to enhance profits. Conversely, a low net margin points to the need for cost-cutting or operational improvements to sustain profitability.
Effective margin analysis also informs strategic shifts, such as entering new markets or adjusting product lines. Businesses use these insights to weigh the financial feasibility of new initiatives. For instance, if the net margin is declining, a company might revise its budget allocations to prioritize more profitable ventures.
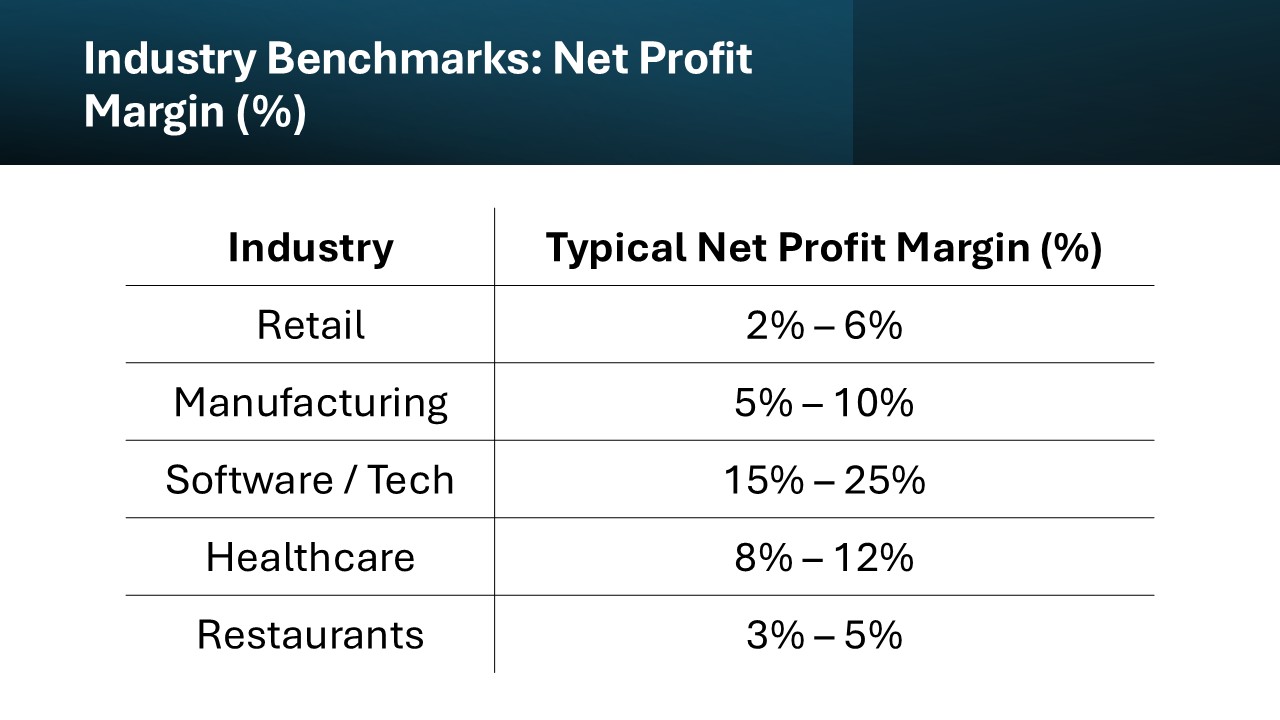
Industry Standards and Variations
Profit margins can vary widely across industries due to differing cost structures and revenue models. For instance, retail typically exhibits lower net profit margins, often around 5-10%, due to high operating costs. Conversely, industries like software or pharmaceuticals might show higher margins, often exceeding 20%, due to lower COGS and high demand for innovation.
Industry standards serve as benchmarks, helping companies assess their competitive position. Variations can also indicate unique market conditions or operational efficiencies. Comparing a company’s margins against industry averages helps identify potential strengths or areas for improvement.
Strategies to Maximize Profits
Improving Gross Profit Margin
Improving gross profit margin involves focusing on reducing the cost of goods sold (COGS) and enhancing pricing strategies. Companies can renegotiate supplier contracts to achieve better terms, utilize economies of scale to reduce per-unit costs, or invest in more efficient production technologies to lower manufacturing expenses.
Additionally, optimizing pricing strategies plays a crucial role. Conducting market research to understand the competitive landscape and customer willingness to pay can lead to strategic pricing adjustments that enhance margins. Implementing a tiered pricing model or promoting higher-margin products are effective tactics.
Enhancing Net Profit Margin
To enhance net profit margin, organizations must take a comprehensive approach to managing all expenses, not just those involved in production. Streamlining operations is a key strategy, which can involve automating processes, improving supply chain efficiency, and reducing overhead through cost-saving initiatives.
Focusing on increasing revenue through diversification of products or entering new markets can also bolster net profit margins. Additionally, effective tax planning and debt management can help minimize financial drain, directly contributing to improving the bottom line. Realizing net profit enhancement requires ongoing financial monitoring and strategic adjustments.
Benchmarking Against Competitors
Benchmarking against competitors is crucial for evaluating your business’s performance in context. By comparing gross and net profit margins with peers, you can identify competitive advantages or areas needing improvement. Analyze competitors’ financial reports, focusing on how they manage costs and generate revenue.
This process uncovers industry trends and best practices, offering insights into effective strategies adopted by market leaders. Understanding where you stand relative to competitors enables informed decision-making, whether through refining pricing strategies, reducing costs, or enhancing product offerings. Regular benchmarking fosters continuous improvement and strategic alignment with market expectations.
Common Misconceptions
Can Net Margin Surpass Gross Margin?
No, net margin cannot surpass gross margin. Gross margin reflects the excess of revenue over the cost of goods sold (COGS), while net margin accounts for all other expenses, including taxes and operational costs. Since net margin factors in additional deductions from gross profit, it will always be less than or equal to the gross margin.
Why High Net Margins Aren’t Always Positive
High net margins might indicate profitability, but they can also hint at underlying issues. For instance, excessively high margins could suggest overpricing, leading to potential customer dissatisfaction or loss of market share. Such margins might also reflect cost-cutting measures that could negatively impact product quality or employee satisfaction. Therefore, while high net margins are generally positive, they require a balanced approach to ensure long-term sustainability and brand equity.
FAQs
What is a good gross profit margin?
A good gross profit margin varies by industry but generally falls between 20% and 40%. Industries like technology may have higher margins due to lower production costs, while retail may see lower margins due to higher COGS. It’s crucial to compare margins within the same industry to get an accurate assessment of performance.
How do you calculate net profit margin?
You calculate net profit margin by dividing net income by total revenue and then multiplying the result by 100 to get a percentage. The formula is: (Net Income / Revenue) x 100. This metric reflects the percentage of revenue that remains as profit after all expenses have been deducted.
Why is understanding revenue vs margin important in business?
Understanding the distinction between revenue and margin is crucial, as revenue only indicates the total income generated, while margin reflects profitability efficiency. Revenue growth might be misleading if accompanied by shrinking margins, signaling rising costs or inefficiencies. Analyzing both ensures a comprehensive view of financial health, guiding strategic decisions on pricing, cost management, and expansion.
Why is understanding profit margins crucial for business success?
Understanding profit margins is vital because it offers insights into a company’s financial health and sustainability. Margins reveal how effectively a business manages its production costs and expenses relative to revenue. This understanding helps in making informed strategic decisions, setting competitive prices, and identifying cost-saving opportunities, ultimately driving long-term growth and profitability.
What are the limitations of focusing solely on one type of margin?
Focusing solely on one type of margin can lead to a skewed understanding of a business’s financial health. For instance, a strong gross margin might mask high operational costs reflected only in a net margin analysis. Ignoring net margins could overlook inefficiencies or excessive expenses. Therefore, a balanced assessment using both gross and net margins is essential for a comprehensive financial evaluation.
What gross profit margin percentage is good for a company?
A good gross profit margin typically ranges from 20% to 40%, varying by industry. For instance, companies in sectors like software may boast higher margins due to lower direct costs, while manufacturing might see lower margins because of higher production expenses. Comparing within the same industry provides a more accurate assessment of what constitutes a healthy margin.