KEY TAKEAWAY
- Days Inventory Outstanding (DIO) is a critical liquidity metric that measures the average number of days that a company takes to sell its inventory. A lower DIO is usually indicative of efficient inventory management, implying that the company is effectively converting its inventory into cash within a short duration and minimizing the risks associated with inventory obsolescence.
- DIO has a direct effect on a business’s working capital as it indicates the amount of cash tied up in the inventory. When the DIO is high, a significant portion of the company’s working capital is occupied with maintaining the inventory, potentially leading to higher storage costs and the risk of inventory spoilage or obsolescence. Conversely, a lower DIO means less capital is dedicated to stock, freeing up funds for other operational needs or business expansion.
- Proper management of DIO is essential for optimizing working capital usage. Reducing DIO can increase available working capital, which allows for greater financial flexibility in the business. This additional capital can be deployed for various purposes, such as investing in growth initiatives, reducing debt, or enhancing overall business profitability.
Why Understanding DIO is Essential for Businesses
Understanding Days Inventory Outstanding (DIO) ratio is like having an insider’s view into the efficiency of your business’s operations. It’s essential because it offers a glimpse into how well you’re managing your stock levels. By keeping tabs on DIO, businesses can steer clear of overstocking, which can squeeze your cash flow, and avoid stockouts that lead to missed sales and unhappy customers. Balancing inventory is a juggling act, and DIO informs you if you’re a pro juggler or if you need more practice.
- Savvy Inventory Forecasting: By examining DIO trends, businesses can predict demand more accurately, ensuring the right amount of product is available when customers reach for it.
- Cost and Revenue Balance: DIO sheds light on the delicate ballet between the costs of holding inventory and the risks of not having enough, affecting both bottom-line expenses and top-line revenue.
Days Inventory Outstanding isn’t just a number—it’s a vital pulse check on a business’s ability to meet market demand with precision and agility.
The Anatomy of the DIO Formula
Breaking Down the DIO Calculation
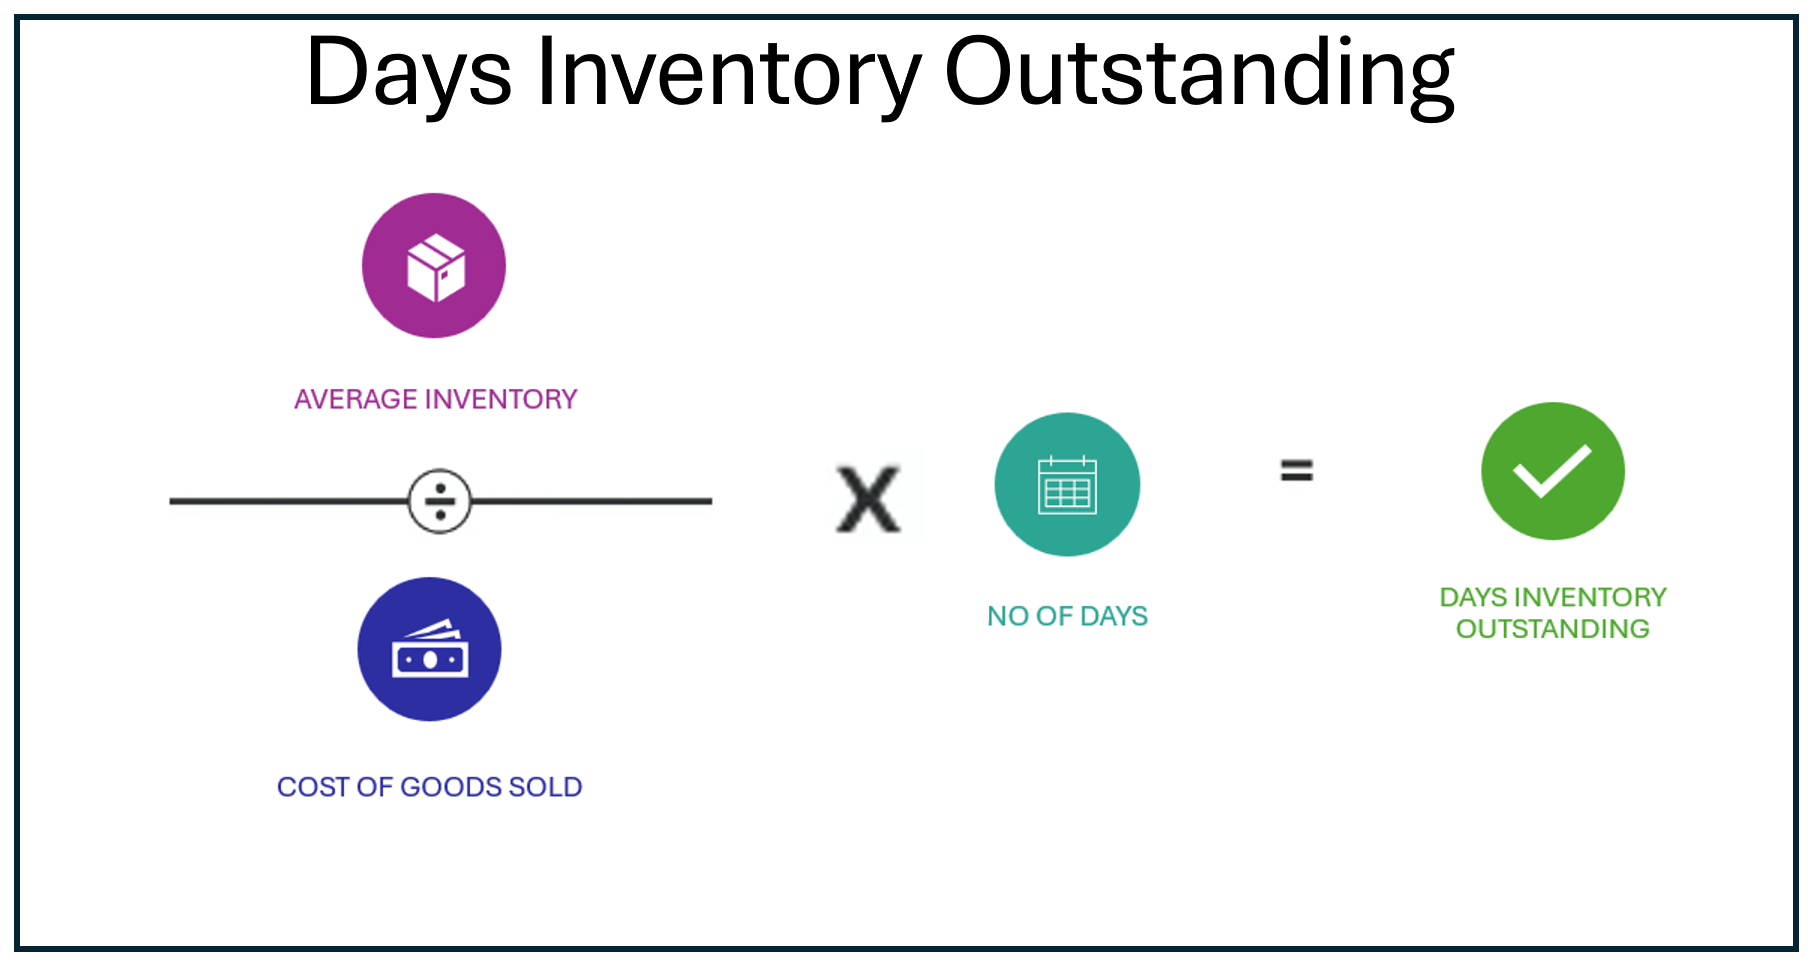
Breaking down the DIO calculation might conjure up memories of math class, but it’s simpler than it looks. Here’s the formula you’ll be getting familiar with:
Days Inventory Outstanding (DIO) = (Average Inventory / Cost of Goods Sold) × 365 Days
Common Pitfalls in Calculating DIO
When calculating DIO, several pitfalls could trip you up. Here’s what to watch out for:
- Inaccuracy in Inventory Data: The quality of your DIO calculation hinges on the accuracy of your inventory records. Inconsistent or erroneous data or inventory valuation can skew your DIO, leading to poor management decisions.
- Overlooking Inventory Fluctuations: Seasonal businesses or those with sales cycles might have significant inventory level changes. Not accounting for these can result in a distorted DIO.
- Singular Data Points: A DIO figure based on a single point in time may not give the full picture, especially in dynamic market conditions. It’s essential to observe the trend over multiple periods.
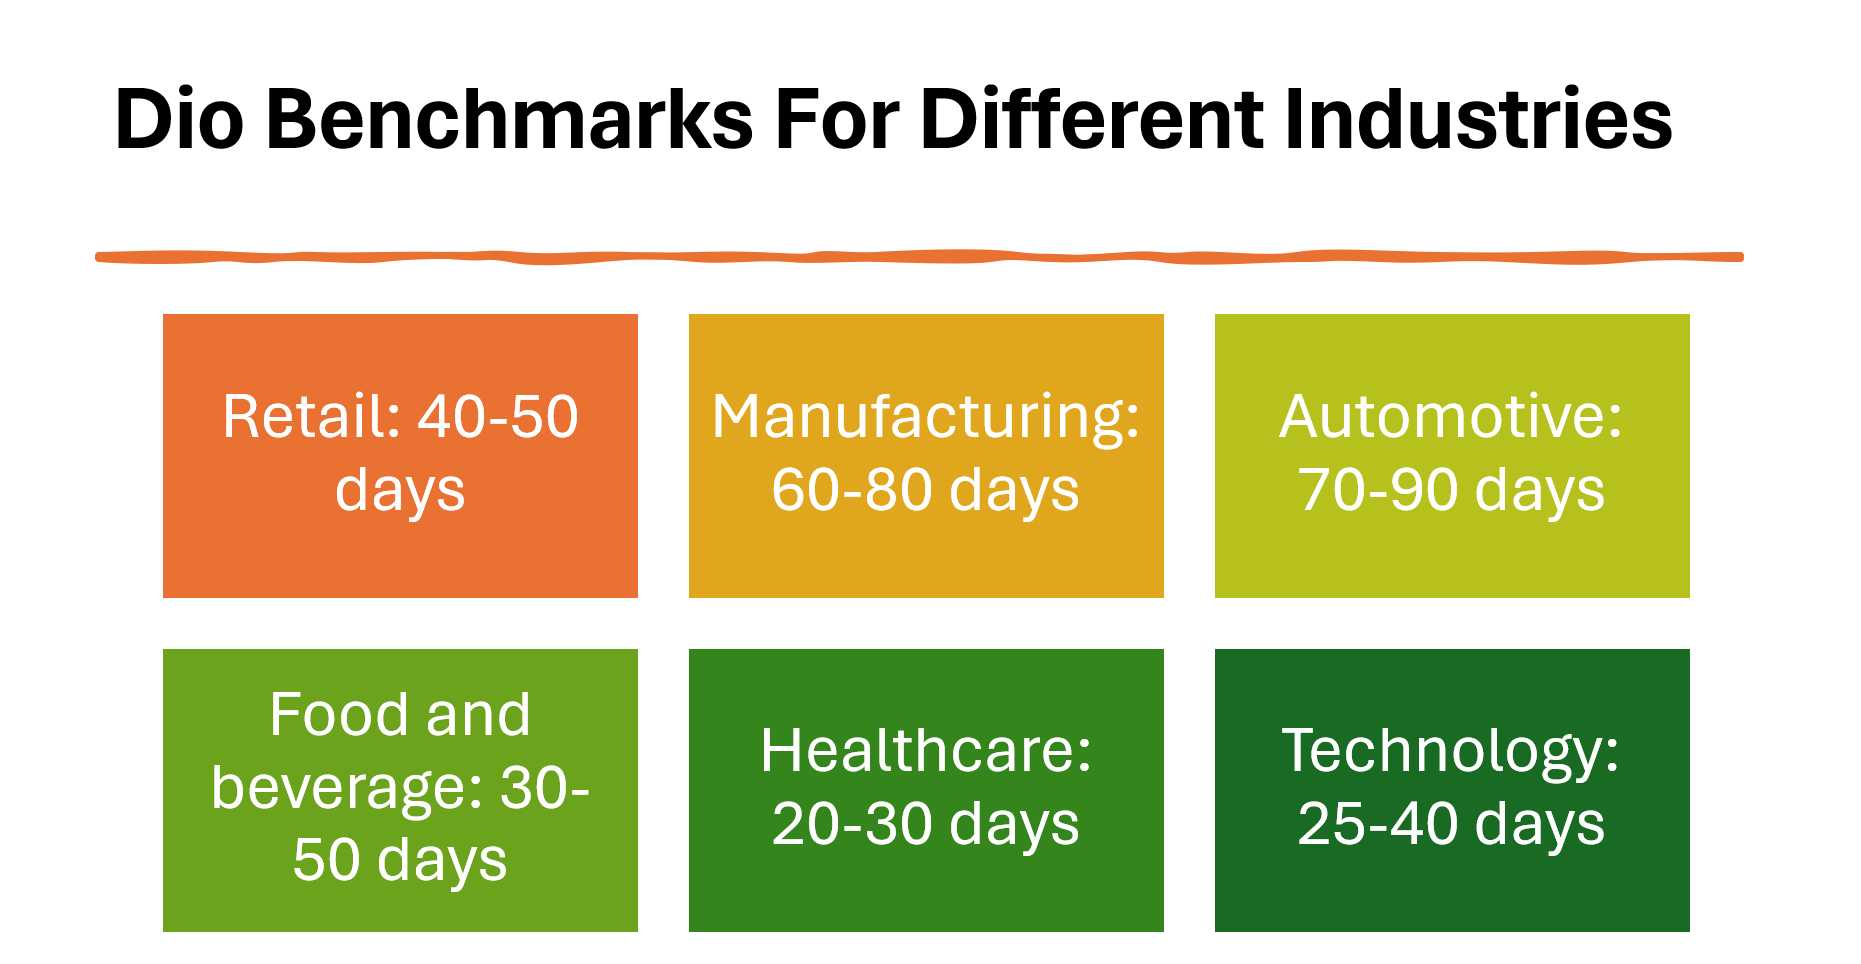
- Failing to Account for Industry Nuances: Every industry has its context and pace, which affect what’s considered a “healthy” DIO. Neglecting these specific contexts can render your DIO comparisons meaningless.
Remember, regular checks and a critical eye can help mitigate these issues and maintain a robust inventory management system.
Practical Examples for Clarity
Walkthrough of a Sample DIO Calculation
To illustrate how DIO is calculated, picture a simple scenario:
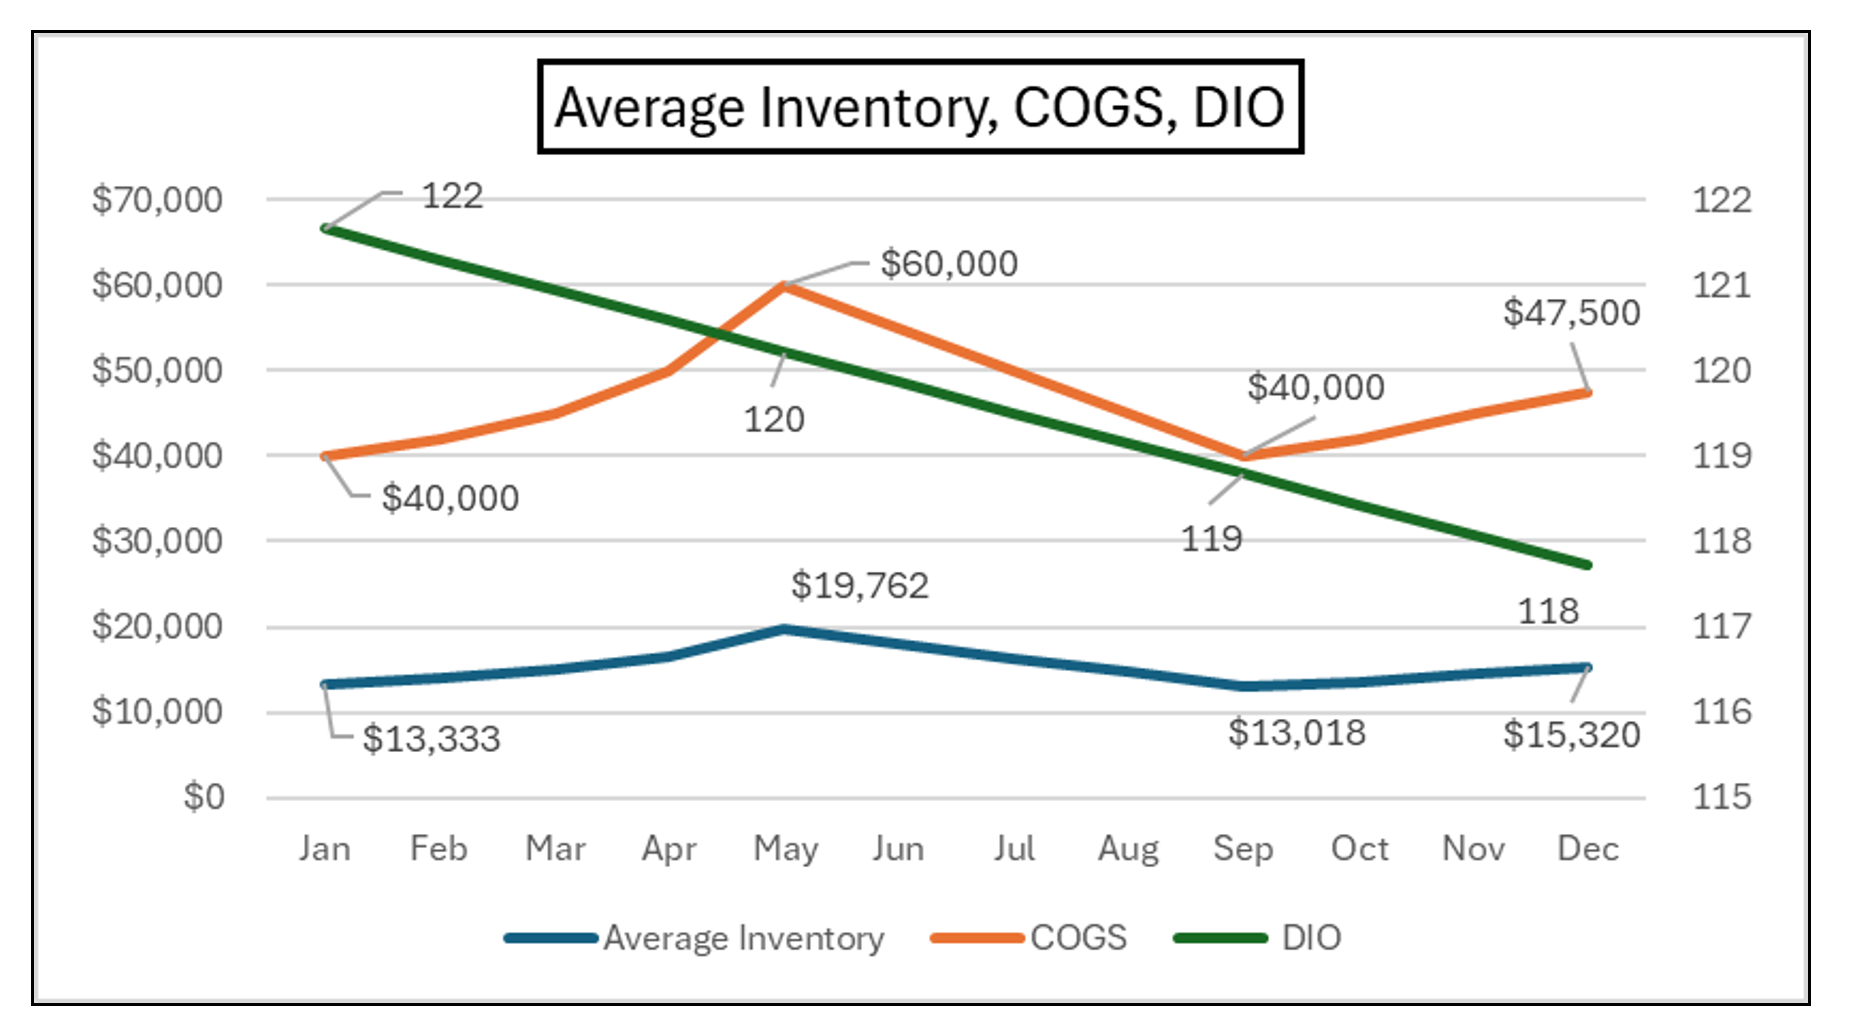
Imagine that your business has an average inventory worth $50,000 and the cost of goods sold (COGS) for the year tallied up to $600,000. Here’s how the formula applies:
DIO = {Average Inventory / Cost of Goods Sold} x times 365 ) DIO = {$50,000 / $600,000} X times 365 ) DIO = approx 30.42 days
This means that, on average, it takes approximately 30.42 days for your inventory to be sold and replaced within a year. It’s a quick, revealing peek into the inventory’s lifecycle from purchase to sale.
Understanding this number is one thing; knowing what to do with it is another. Comparing it against industry standards or past performance can help you gauge how well your inventory is managed.
Real-World Implications of DIO Figures
DIO figures aren’t just digits on a spreadsheet; they carry real-world implications for your business. A low DIO indicates your inventory moves quickly – that’s great news if it aligns with your business strategy! It suggests a lean approach, minimizing holding costs and indicating potentially high liquidity.
Conversely, a high DIO can signal stale stock or overbuying, which ties up capital and may require clearance sales to rectify, impacting profit margins.
- Stock Optimization: DIO informs how much stock you should carry to meet demand without overcapitalizing.
- Strategic Buying: It can guide purchasing strategies, helping to negotiate better terms or timing with suppliers.
- Customer Satisfaction: Keeping DIO at an optimal level ensures customers find what they need without undue delay.
Navigating through the intricacies of DIO helps you to fine-tune your business processes, enhancing your operational efficiency and customer satisfaction – pivotal factors for staying competitive in today’s market landscape.
Interpreting Your DIO Results
What Constitutes a Good DIO Number?
A “good” DIO number varies greatly by industry due to different turnover rates of products. Generally, a lower DIO is favorable as it suggests a speedy conversion of stock into sales. However, “good” is relative:
- By Industry Standards: Compare your DIO with average figures within your industry to understand how you stand.
- Against Historical Performance: Look at your past DIO numbers to see if you’re improving or if there’s a slowdown.
- Strategic Objectives: Your business model might require a slightly higher DIO if, for instance, you’re prioritizing a wide product variety over rapid turnover.
A good rule of thumb is that your DIO should align with your business goals and the operational norms of your sector.
The Impact of High and Low DIO on Business Health
High DIO: Potential Warning Sign A high DIO often flashes warning lights for a business, as it can mean inventory isn’t turning over quickly enough. This could tie up funds, bloat storage costs, and risk obsolescence. But context is key; for certain industries like luxury goods, a higher DIO might be part of the strategy.
Low DIO: Sign of Efficiency A low DIO can be the hallmark of a lean and agile operation, indicating your business is effective at converting inventory into sales quickly. You’re keeping the inventory just long enough to meet demand, which can improve cash flow and reduce storage costs.
- Financial Health: DIO affects cash flow tightly. A balanced DIO supports a healthier financial posture.
- Operational Efficiency: High DIO can indicate operational hiccups, while low DIO suggests a streamlined process.
- Market Responsiveness: Low DIO positions businesses to adapt quickly to market changes.
However, too low could also hint that you might miss sales opportunities due to insufficient stock. Striking the right balance is crucial for sustaining a resilient, responsive business.
Steps to Optimize Your Inventory Management
Strategies to Improve DIO Performance
If your DIO figure is keeping you up at night, consider these strategies to improve your inventory’s performance:
- Efficiency: These strategies can lower your DIO, improve operational efficiency, and boost financial flexibility.
- Competitiveness: A better DIO can lead to more agility in responding to market changes, making you more competitive.
- Customer Satisfaction: Speedier turnover often means more up-to-date stock, which can translate to happier customers.
Remember, the best strategy will be tailored to fit your unique business model and circumstances.
Leveraging Technology for Better Inventory Control
Harnessing the power of technology is like equipping your business with a high-precision, digital compass for navigating the complex seas of inventory management. Here’s how you can leverage tech to keep a firm grip on your inventory control:
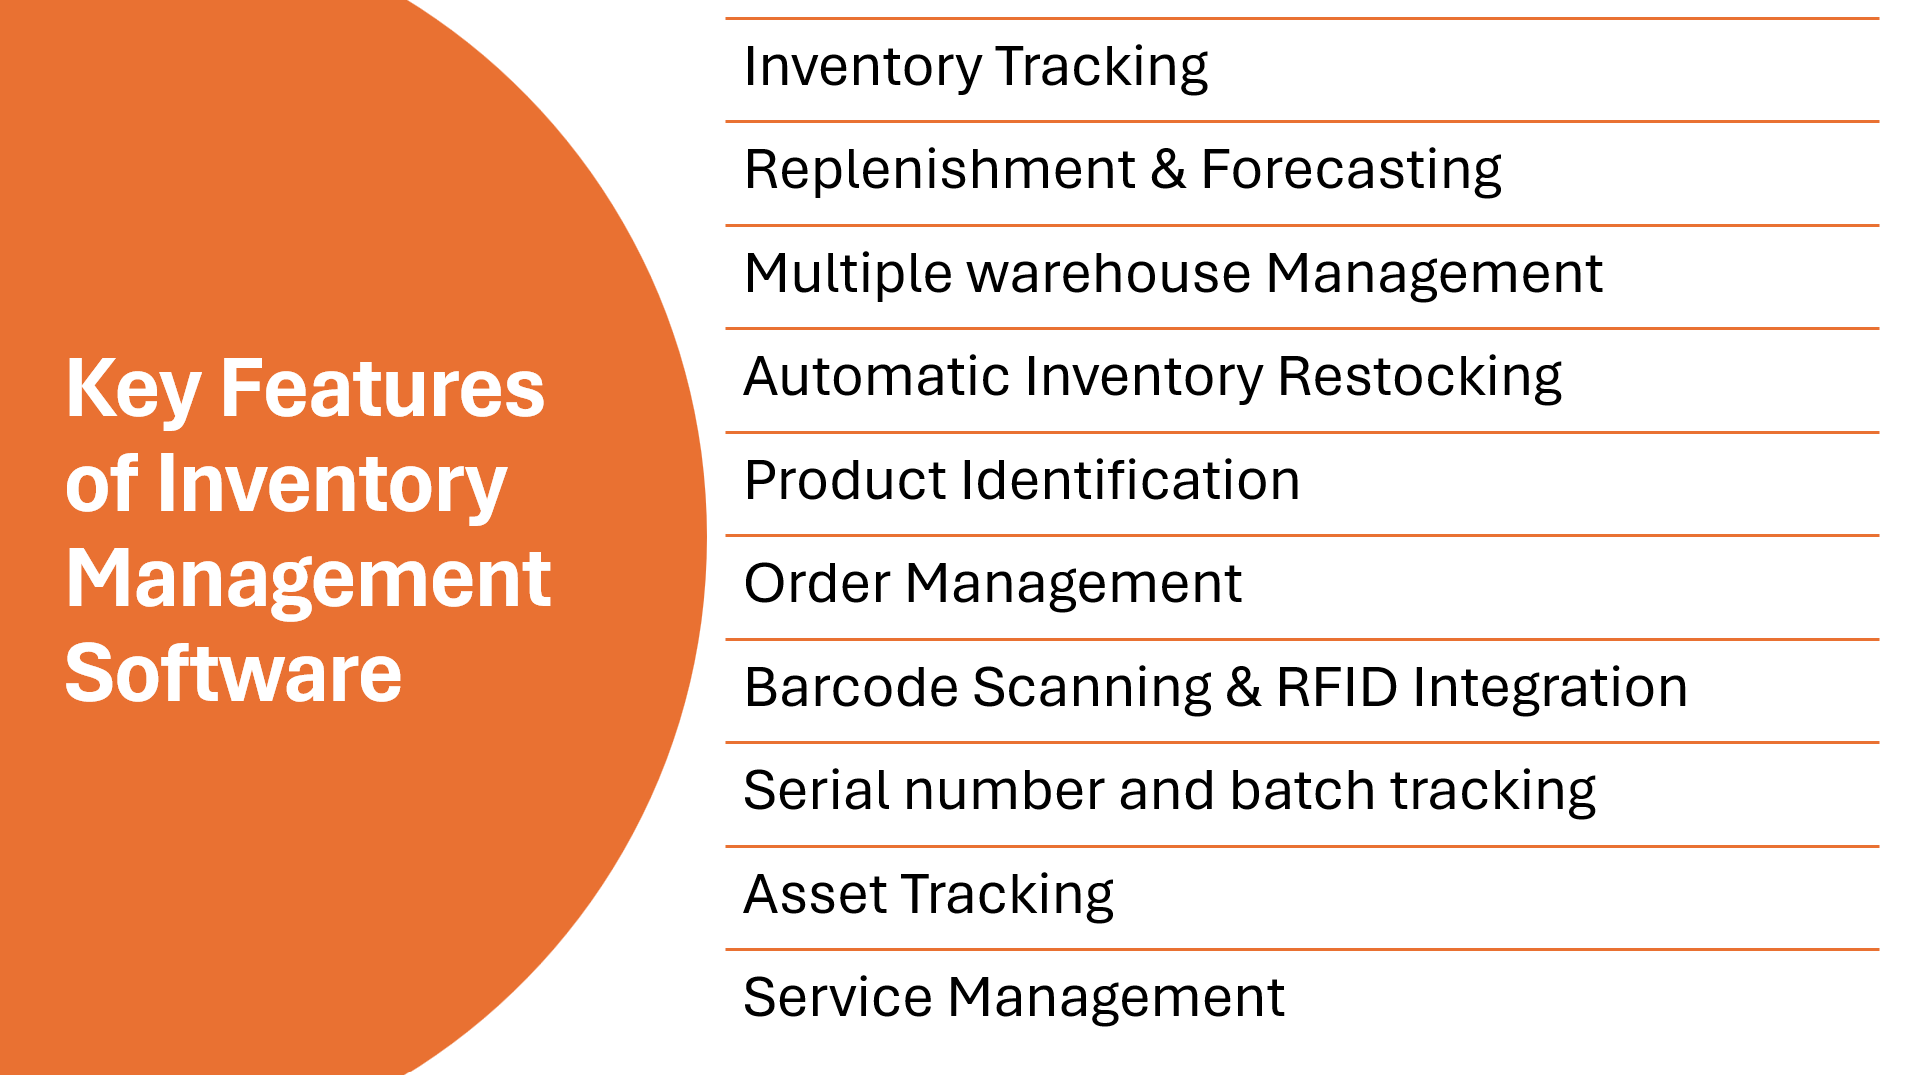
- Inventory Management Software: These systems offer real-time tracking and analytics, so you always know where your stock levels stand.
- Automated Reordering: Set up triggers for when stock dips below a certain point, ensuring you’re never caught short.
- Advanced Forecasting Tools: Utilize machine learning and AI to predict trends and optimize your stock levels with greater accuracy.
- RFID & Barcode Technology: Employ these for quick, error-free tracking of inventory as it moves throughout your business.
- Cloud-Based Solutions: They offer accessibility and scalability, helping you to stay agile as your business grows and changes.
Incorporating these technological advancements doesn’t just cut down on manual errors – it boosts efficiency and can significantly influence your DIO for the better.
- Visibility: Tech offers unparalleled visibility into inventory movements, critical for nimble decision-making.
- Accuracy: With technology, the room for human error shrinks, resulting in more accurate DIO figures.
- Time Savings: Automated processes mean you spend less time counting and more time on strategic planning.
What DSI Tells You
DSI Vs. Inventory Turnover
DSI (Days Sales in Inventory) and Inventory Turnover Ratio are vital metrics for evaluating a company’s inventory management. DSI measures the average duration inventory takes to be sold, with a higher DSI indicating slower inventory movement and possible increased holding costs. Inventory Turnover, calculated as cost of goods sold divided by average inventory, reflects how often inventory is sold and replenished within a certain period. A higher turnover suggests more efficient inventory management by indicating quick sales generation from inventory. These metrics have an inverse relationship: higher Inventory Turnover leads to a lower DSI, signaling faster inventory sales. However, extremely high turnover may point to potential stock shortages and missed sales opportunities, highlighting the need for a balance between inventory levels and sales demands. Together, DSI and Inventory Turnover offer comprehensive insights into inventory efficiency, but should be considered alongside industry standards for a full assessment.
DSI constitutes the initial segment of the cash conversion cycle (CCC), a three-part metric that tracks the journey of converting raw materials into cash through sales. The subsequent stages in this cycle are days sales outstanding (DSO) and days payable outstanding (DPO). DSO assesses the average time a company takes to collect payment on its receivables, whereas DPO gauges the average time a company takes to settle its payable accounts. Collectively, the CCC aims to quantify the average period each dollar of net investment (cash) remains invested in the operational cycle—from production through to the realization of cash from customer sales.
Example of DSI
DSI, or Days Sales of Inventory, is an important financial metric that helps businesses gauge the efficiency of their inventory management. To illustrate how a high DSI can be strategically advantageous, let’s consider a scenario related to agricultural production and market dynamics.
- Imagine a severe drought in a region known for producing soft water, which leads to an anticipation of water supply coming from a different area with hard water.
- Due to this shift, residents may soon need water purifiers to handle the change in water quality.
- Companies producing water purifiers, upon recognizing this upcoming surge in demand, might decide to increase their inventory levels despite a high DSI value.
- Holding more inventory under these conditions is a calculated move, as selling these water purifiers later, when demand spikes, could command higher prices and improve company profits.
- In this scenario, a high DSI is leveraged to the company’s advantage, highlighting the necessity to interpret DSI within the context of prevailing market conditions and future market trends.
This example showcases that while a lower DSI generally indicates a more efficient conversion of inventory into sales, in certain market situations, a higher DSI can lead to strategic stockpiling, which may result in significant financial benefits in the long term.
FAQ – Days Inventory Outstanding Unraveled
Is a Higher or Lower DIO Preferable?
Generally, a lower DIO is preferable because it means that inventory is being sold and replenished quickly, which is usually indicative of efficient inventory management, a strong sales cycle, and good cash flow. However, the context matters, as some business models may require a higher DIO.
How Often Should You Calculate DIO for Accurate Analysis?
You should calculate DIO consistently, at least at the end of each financial quarter. Frequent analysis allows you to catch issues early and adjust strategies effectively for inventory optimization.
Can DIO be Applied Across Different Industries Equally?
No, DIO cannot be applied equally across all industries due to varying product lifecycles and sales processes. It’s best used within the same sector for meaningful comparisons.
What is the difference between days inventory outstanding and inventory days?
DIO and Inventory Days measure the same concept but differ in calculation. DIO is average inventory divided by the cost of goods sold daily, while Inventory Days divides the inventory balance by the daily price of goods sold.
How does days inventory outstanding impacts working capital?
DIO directly affects how much working capital is tied up in inventories. Lower DIO can free up cash, higher DIO can restrict cash flow. Balancing DIO is key for maintaining liquidity.