KEY TAKEAWAYS
- To calculate the break-even sales revenue, understand that it equals the business’s fixed costs divided by the contribution margin ratio, which is calculated as (Sales – Variable Costs) / Sales.
- In practice, with a given example, a break-even sales revenue of $2,966,002 is computed by dividing fixed costs of $1,557,900 by the contribution margin ratio of 52.52525% (obtained from ($9,306,000 – $4,418,000) / $9,306,000).
- For ease of computation and to avoid manual errors, online break-even calculators such as the NASE break-even calculator or the SBA break-even calculator can be utilized, with suggestions to round forecast unit sales to the nearest thousand when entering data.
Why Mastering Break-Even Analysis is Crucial for Business Success
Mastering break-even analysis is like having a roadmap for financial success; it shines a light on the realities of your business operations. Understanding your breakeven point is akin to discovering the formula for financial stability within your venture. It not only reveals when your revenues offset costs, showcasing your operational achievements, but it also aids in determining the gross profit margin percentage, a vital indicator of financial health. By pinpointing this moment, you gain the precision to make informed, data-driven decisions rather than relying on instinct. This lucid insight empowers you to set feasible objectives, price your offerings sagaciously, and pinpoint necessary sales targets to sustain profitability.
Having expertise in break-even analysis is incredibly alluring to investors and lenders. It manifests a deep comprehension of your business dynamics and signifies a capability to pilot the enterprise toward fiscal success. Through a clear understanding of fixed and variable costs, or by computing the contribution margin, you can recalibrate your breakeven point, reflecting the exact financial pulse of your business.
The Essentials of Break-Even Point (BEP)
Break-Down of Break-Even Components
Breaking down the components of break-even analysis allows you to wrap your head around the specifics that dictate when you’ll start seeing green. Here they are:
- Fixed Costs: Think of these as your baseline expenses that don’t fluctuate with production or sales volume – your rent, insurance, taxes and salaried wages.
- Variable Costs: These costs vary directly with your production level. More units produced? Your variable costs like materials and labor will rise.
- Revenue: This is the income you receive from selling your products or services—the lifeblood of your business that needs to pulse strongly.
- Contribution Margin: The difference between the selling to price per unit and the variable cost per unit. It contributes to covering fixed costs and then to profit. Contribution margin calculation becomes crucial in understanding just how much each product contributes to your overall profitability.
- Break-even Point (BEP): This magic number is the amount of units you need to sell or the amount of revenue required to cover all your costs, with profits starting beyond this threshold. Utilizing a break-even point calculator can simplify this process, providing quick insights for strategic decision-making.
Understanding these elements and how they interact is key to mastering break-in analysis, allowing you to chart a path to profitability.
Visualizing BEP with the Sales Calculation
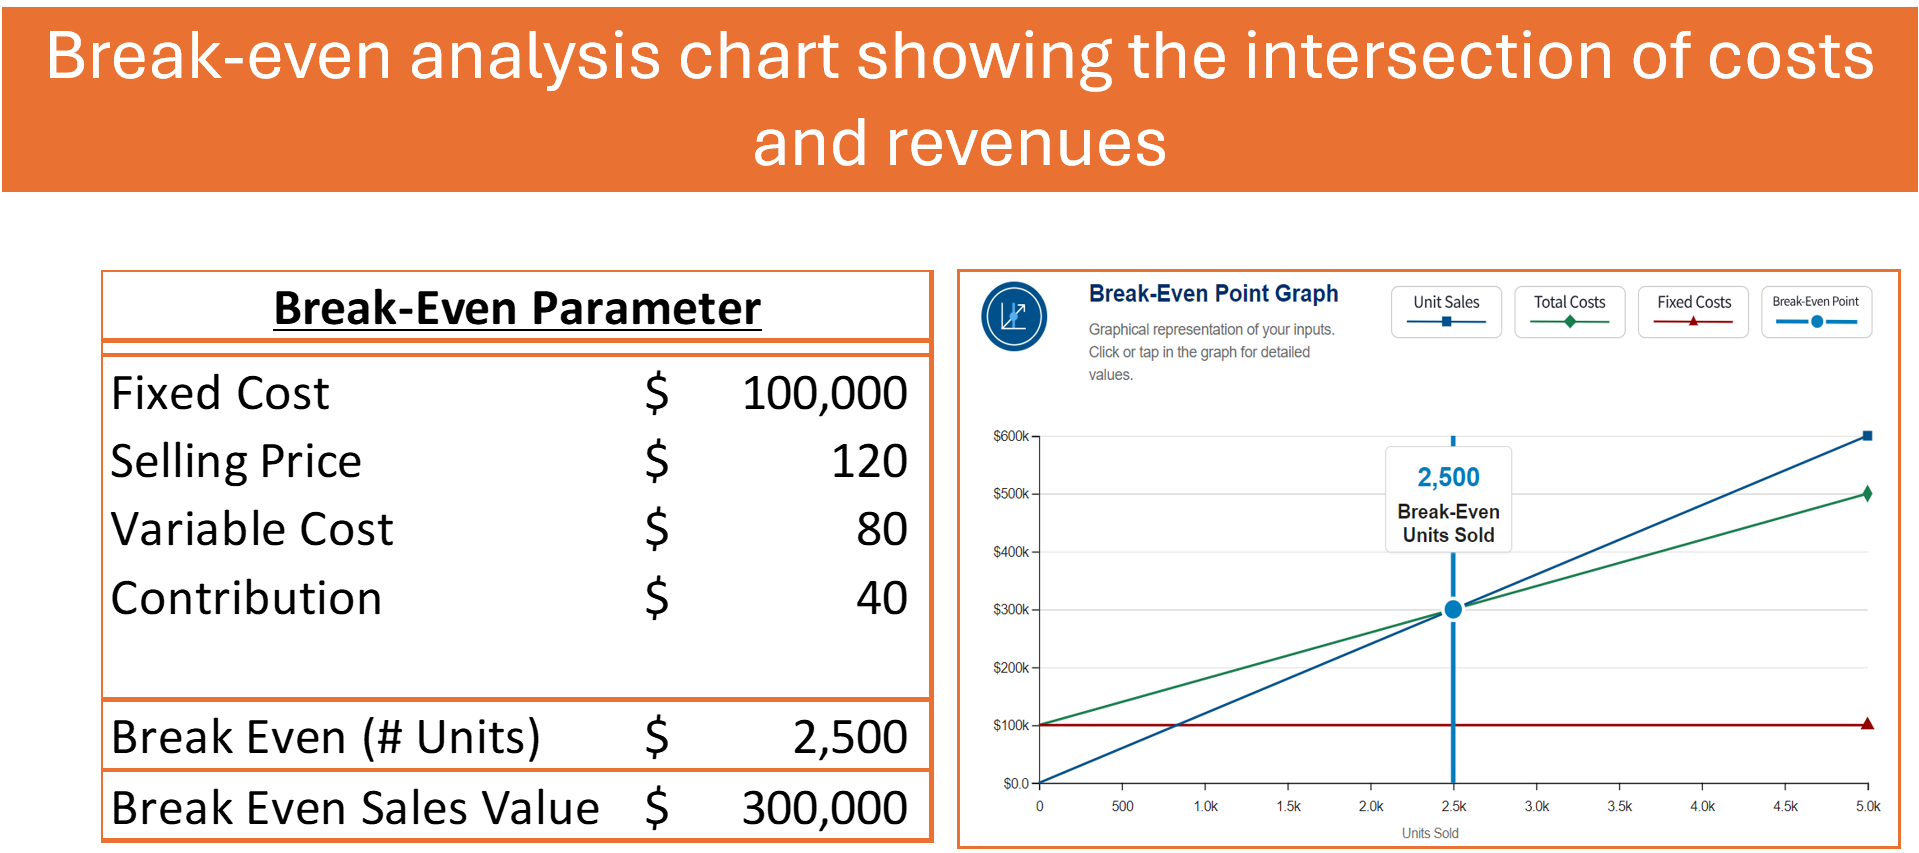
Visualizing your BEP with a sales calculation can transform abstract numbers into a tangible target. Imagine utilizing a sales formula calculator to depict your figures on a graph, where one axis showcases costs and the other, your sales volume—the meeting point of these lines illustrates your BEP. With each sale pushing you nearer to this vital milestone, you can see your progress in real-time.
To make this even clearer, create a visual representation using a chart. Plot out fixed costs as a steadfast horizontal line (since they stay unaltered by sales quantity), while depicting the sum of variable costs and fixed costs as an ascending curve that grows with your sales. With every uptick in sales, your revenue line marches upward, aligning with the previous illustration, and the moment it crosses the sum of your combined costs clearly indicates the achievement of your BEP.
Incorporating these visual aids like graphs or a detailed chart not only demystifies the calculation of the BEP but also serves as an invigorating mechanism for monitoring headway and establishing goals. Charting your path to profitability has never been more straightforward, thanks to the graphical precision tools like our break-even point calculator.
Step-by-Step: How to Calculate Break-Even Sales
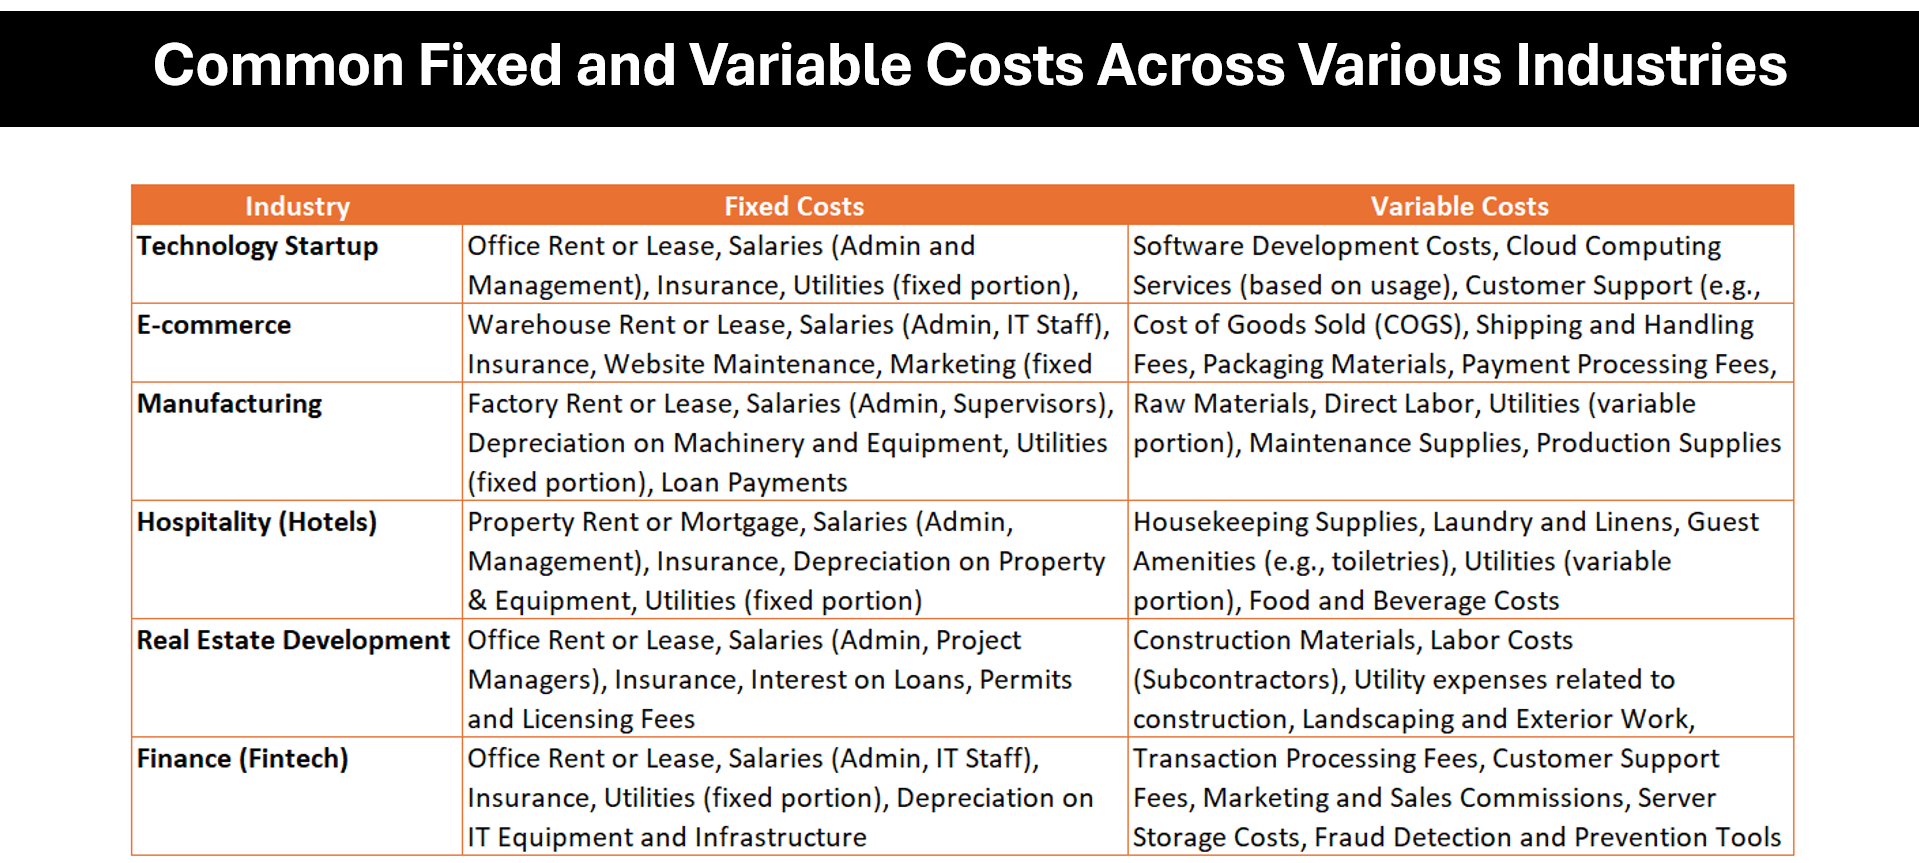
Identifying Your Costs: Fixed vs. Variable
Identifying and categorizing your costs into fixed and variable is the foundation for any break-even analysis. Remember, fixed costs are those steadfast expenses that you’re committed to paying, regardless of your business’s output—like the monthly rent for your storefront or the yearly insurance. These are part of your accounting costs that remain unchanged across the accounting periods. They’re predictable and consistent over time.
On the other hand, variable costs are the more dynamic siblings, scaling up or down depending with your production volumes. These could include components like direct labor or cost of goods sold, which vary as your business activity changes—integral elements in your break-even analysis. Think about the raw materials for your products or the hourly wages for your staff. As production ramps up to meet demand, these accounting costs will rise proportionally.
It’s essential to distinguish between these costs accurately because it impacts every other aspect of break risks analysis. Knowing your fixed costs tells you how much you need to earn to reach your break-even point—a critical juncture where your total costs equate to your total revenue. Meanwhile, understanding your variable costs helps you determine your pricing and profitability per unit sold, which is vital for sustaining the financial health of your enterprise.
The Formula that Makes Sense of Sales Goals
To put it plainly, the formula to calculate break-even sales boils down to this: Fixed Costs ÷ (Selling Price per Unit – Variable Cost per Unit). This ratio is known as the contribution margin, and it’s a critical concept in cvp analysis (cost-volume-profit analysis), signifying the proportion of each sale that contributes to covering your fixed costs.
Once your fixed costs are divided by this margin, key in cost-volume-profit analysis, the result is the number of units that need to be sold to break even. Throwing sales goals into the mix just scales the equation up, setting benchmarks for desired profit levels above the break-even point. Adding a desired profit, say $1000, shifts the focus from merely covering costs to achieving specific financial objectives as outlined in a typical cvp analysis.
This deceptively simple equation is powerful—it transforms abstract financial goals into concrete sales targets that can guide everything from pricing strategies to marketing efforts, all while serving as the backbone of effective cost-volume-profit analysis.
Real-World Applications of Break-Even Analysis
Informed Pricing Strategies through BEP Insights
Informed pricing strategies are a direct benefit of an in-depth understanding of your break-even point. BEP insights allow you to evaluate whether your pricing model can sustainably cover costs while maintaining competitive edge and profitability. It helps answer critical questions like: Are we pricing our products too low to cover our fixed and variable costs? Is there room to increase prices without affecting demand?
A price that’s too high could dissuade customers, while a price that’s too low might not cover your costs, leading to business losses. BEP analysis fine-tunes this balancing act by indicating the minimum amount you need to charge per unit to meet financial obligations and desired profit margins.
Additionally, BEP can guide decisions on volume discounts, promotional strategies, and help you understand the financial implications of price changes. When you see exactly how pricing affects your break-even point, you can adjust your strategy with confidence.
Funding and Financial Decision Making with a BEP Focus
With a BEP focus, funding and financial decisions become clearer and more strategic. Knowing your break-even point can be a persuasive tool when securing loans or attracting investors. It tells them that you understand the critical metrics of your business and have a concrete plan for reaching profitability.
From the lender’s or investor’s perspective, a business that knows its BEP is deemed a safer bet. It demonstrates a level of financial literacy and planning that reduces perceived risk. Additionally, BEP can serve as a benchmark against which the performance of a business can be tracked over time, offering a measure of the impact of investments or loans on business growth.
Using break-even analysis in financial decision-making can also guide you on when to expand, scale back, or pivot your business operations. This focused approach can help ensure that you’re not taking on more debt than necessary and that you’re utilizing any funding received in the most effective way possible.
Maximizing Resources with Break-Even Tools
Break-Even Calculation Aids: Software and Spreadsheets
Calculating the break-even point is crucial for any business to understand at what point it will start generating profits. Break-even sales analysis can be significantly simplified using software and spreadsheets. Here’s a breakdown of how such aids can help in break-even calculations.
Software and Spreadsheet Aids for Break-Even Calculation:
- Pre-Designed Templates: Software and spreadsheets often come with pre-designed templates for break-even analysis. These templates typically include all the fields required to input costs, sales price, and other relevant data.
- Automated Calculations: Once you input your fixed costs, variable costs per unit, and the sales price per process, the software automatically calculates the break-even point in terms of units or sales dollars.
- What-if Analysis: Spreadsheets allow you to perform ‘what-if’ scenarios. You can change the values of various parameters to see how they affect the break-even point. This helps in strategic planning and price setting.
- Graphical Representation: Many break-even analysis tools provide charts and graphs that visually represent the break-even point, making it easier to comprehend and present to stakeholders.
- Integration with Financial Data: Software can often be integrated with other financial systems to pull in real-time data for more accurate and dynamic analysis.
- Educational Resources: Certain break-even calculation tools come bundled with educational resources and guides, aiding users in understanding the concept and methodology behind the calculations.
- Sensitivity Analysis: Some spreadsheets are advanced enough to include sensitivity analysis, which assesses the risk involved in business decisions by accounting for changes in input variables.
- Customizable Fields: Depending on the business model, certain variables might differ. Spreadsheet templates usually allow customization to cater to sector-specific or company-specific variables.
- Error Checking: Many break-even software programs include built-in error checking to alert users of potential mistakes in data entry or formulae which can impact the results.
- Historical Data Analysis: Some break-even tools enable the comparison of current data with historical data to track performance over time.
Using spreadsheet software like Excel, complete with a downloadable template for break-even analysis, can streamline the process significantly. By inputting the correct data, the number of units needed to break even can be quickly identified, allowing business owners to make informed decisions about pricing, cost management, and sales strategies.
FAQ: Demystifying Break-Even Analysis
What Exactly is a Break-Even Point in Sales Terms?
A break-even point in sales terms is a critical financial metric where total sales revenue matches total expenses, indicating no profit or loss. Understanding this point aids in budgeting, pricing, and strategic decision-making.
The break-even point signifies the minimum sales needed to cover all costs. Surpassing it leads to profits, while falling below results in losses, suggesting the need for financial adjustments. It considers both variable costs (which change with production) and fixed costs (which remain constant).
To calculate the break-even point in units, divide fixed costs by the unit contribution margin (selling price per unit minus variable cost per unit). For sales dollars, divide total fixed expenses by the contribution margin ratio (contribution margin per unit divided by selling price per unit).
Reaching the break-even point indicates a sustainable path as the business can cover operating expenses from sales revenue. Achieving it is a positive milestone for financial health.
How Can I Adjust My Business Practices to Achieve Break-Even Faster?
To achieve break-even faster, focus on efficiency and cost reduction by managing food and labor costs, implementing inventory controls, and scheduling labor to avoid overstaffing. Reduce fixed costs by renting premises, negotiating flexible lease terms, and adjusting operating hours to peak times. Increase profit margins through strategic pricing and supplier negotiations, and convert fixed costs to variable by leasing equipment. Additionally, set realistic sales targets and use marketing tactics to boost customer traffic, ensuring profitability beyond the break-even point.
Are There Limitations to What Break-Even Analysis Can Tell Me?
While break-even analysis is a valuable financial tool, it has limitations. Estimating variable costs like utilities can be challenging and imprecise, especially with seasonality, often leading to the use of average costs. The analysis relies heavily on the accuracy of initial data, and any inaccuracies can result in unexpected costs. While it provides a factual basis for decision-making and helps set realistic goals, it doesn’t entirely eliminate emotional decision-making. Additionally, its effectiveness in securing investments depends on the accuracy of cost and price assumptions used in the analysis.`