KEY TAKEAWAYS
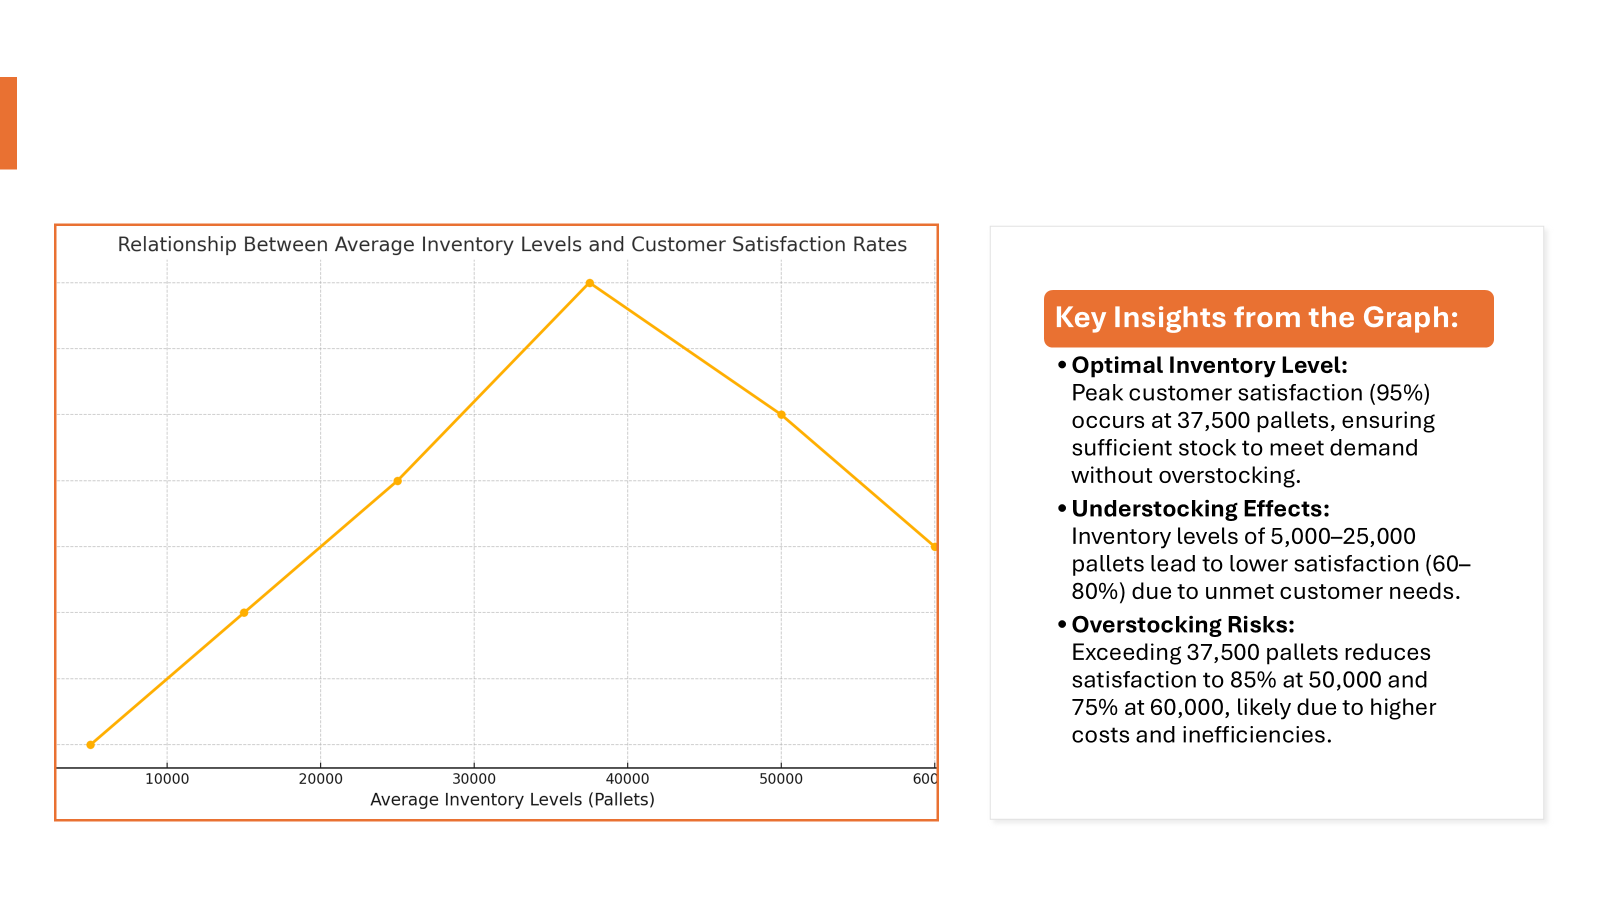
- Average inventory helps in tracking inventory levels over a specific period, aiding businesses to maintain a balanced stock; too much inventory can lead to excess unsold items, while too little can result in lost sales and reputation damage.
- To calculate average inventory, combine the beginning inventory and the ending inventory figures, and then divide that sum by the total number of months within the accounting period you’re analyzing.
- This calculation is a straightforward method that provides a snapshot of a company’s inventory management efficiency, enabling better ordering decisions and inventory control.
The Inventory Equation: A Gateway to Efficient Management
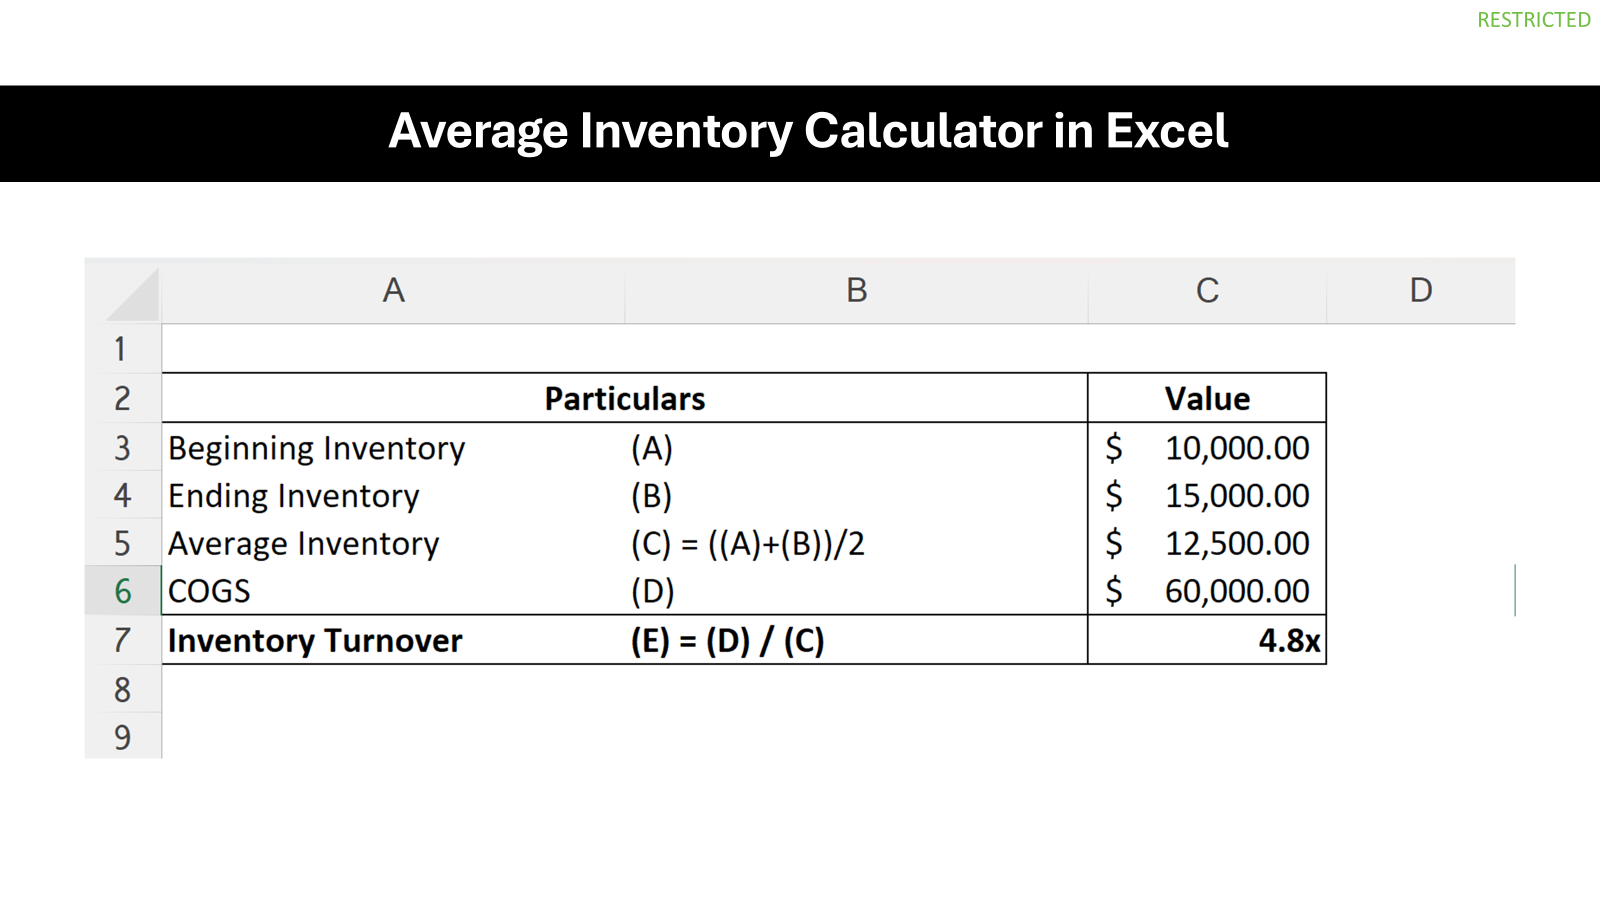
The fundamental inventory equation you need to grasp is: Average Inventory = (Beginning Inventory + Ending Inventory) / 2. This simple formula is your gateway to efficient stock management, offering you a snapshot of inventory health over a given time. By consistently monitoring this equation, you can balance stock levels more precisely, avoid overstocking or stockouts, and make informed decisions regarding when and how much to reorder. Furthermore, understanding your average inventory is crucial since it is instrumental in calculating your inventory turnover ratio, which reflects how often inventory is sold and replaced over a period. Implementing a robust inventory management method will optimize these metrics for greater operational efficiency. Integrating inventory turnover ratio DSI—Days Sales of Inventory—into your inventory reports can sharpen this efficiency even further. The DSI provides insights into the velocity of inventory movement, enhancing your inventory measures and inventory results with a time-based perspective.
Remember, to maintain accuracy in your financial reporting and decision-making processes, it’s essential to periodically review your inventory averages within your inventory reports. Through these inventory measures, businesses can maintain a competitive edge by ensuring they have the right amount of stock at the right time, ultimately translating to better service levels and customer satisfaction.
Explaining the Average Inventory Calculation
Grasping the Standard Formula
Grasping the standard average inventory formula is quite straightforward. When calculating your average inventory, add the value of the inventory at the beginning of a period to the inventory value at the end, and then divide by two. This method accounts for inventory fluctuations, providing a more consistent figure that contributes to precise financial analysis and strategic operational planning. To illustrate this concept, let’s consider the cogs formula that complements the average inventory formula. For instance, if your COGS is a crucial factor in pricing your products or managing profitability, understanding its influence on inventory levels is essential. By integrating the COGS alongside the beginning and ending inventory values, you get a more comprehensive insight into your inventory turnover ratio, which is calculated as COGS divided by average inventory.
Real-World Examples Simplified
Let’s simplify with a real-world example: Imagine a bookstore starts the month with a $5,000 inventory. Over four weeks, books are sold, more are ordered, and by month’s end, the inventory is $7,000. Using the average inventory formula, add the beginning ($5,000) and ending ($7,000) inventory, getting $12,000. Divide by two, voila! The average inventory for that month is $6,000. This example illustrates how the business maintained an adequate supply of books to meet customer demand without overstocking.
Methods for Calculating Average Inventory
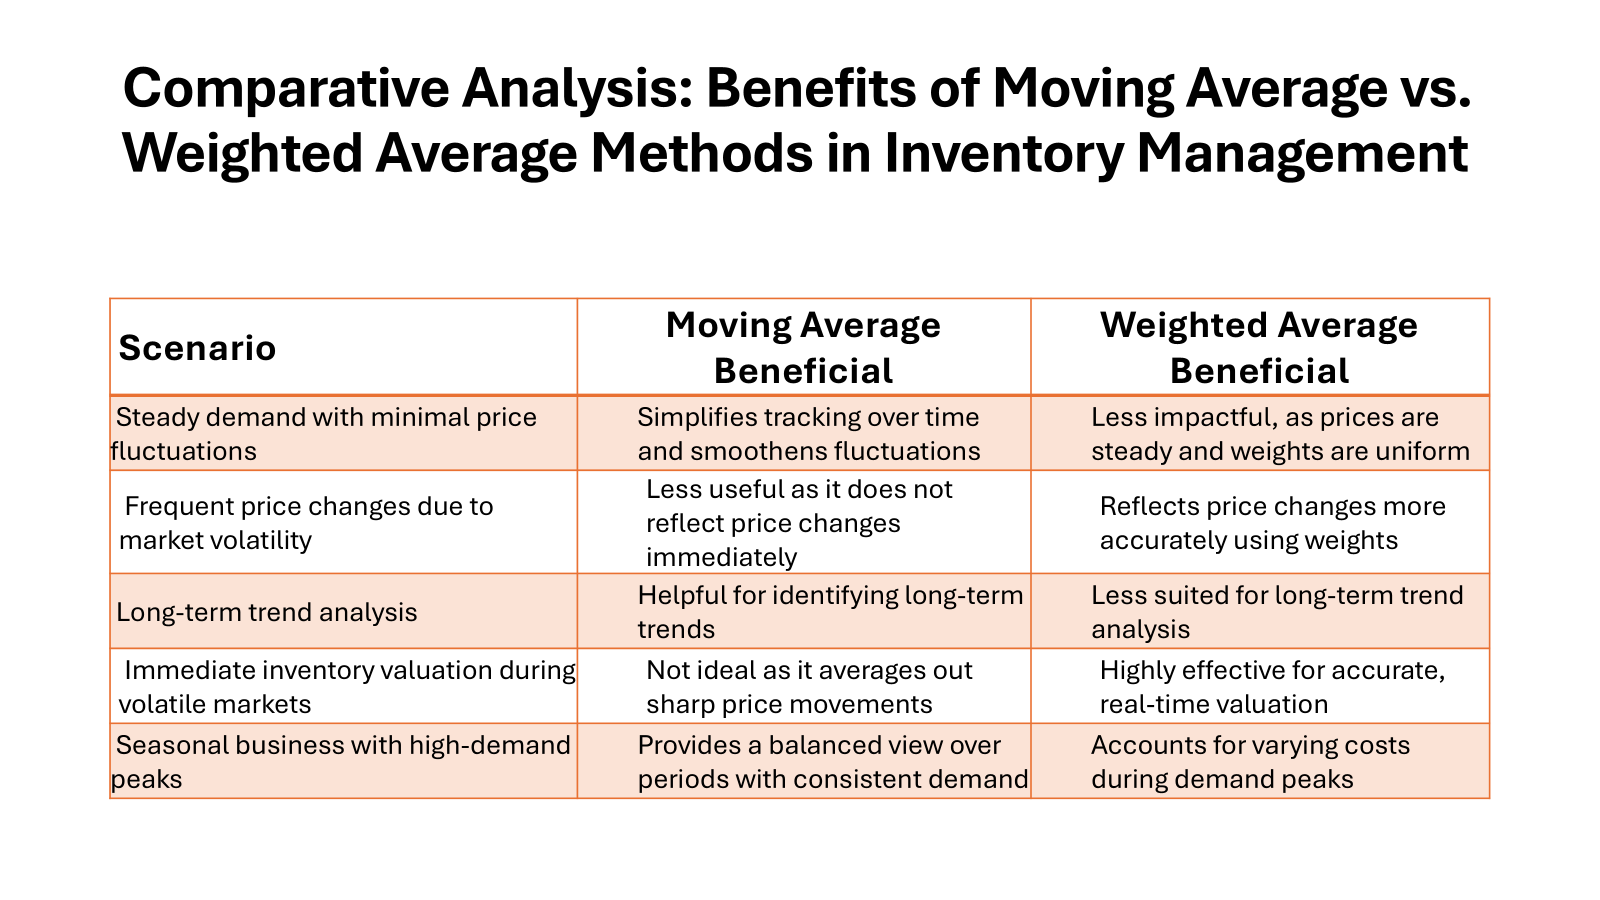
Moving vs Weighted Average Method: Which Suits You?
When deciding between the moving and weighted average inventory methods, consider the nature of your stock and business needs. The moving average method is updated at each purchase, offering you a current average cost after each inventory acquisition. It’s a great fit if you’re seeking precise tracking in real-time, suitable for fast-moving or volatile goods.
The weighted average method, on the other hand, takes into account the volume of good purchased at varying prices and is typically calculated at the end of a period. This system works well for businesses with more stable inventory prices or those not needing immediate updates after each purchase.
Economic Order Quantity and Its Role in Inventory Management
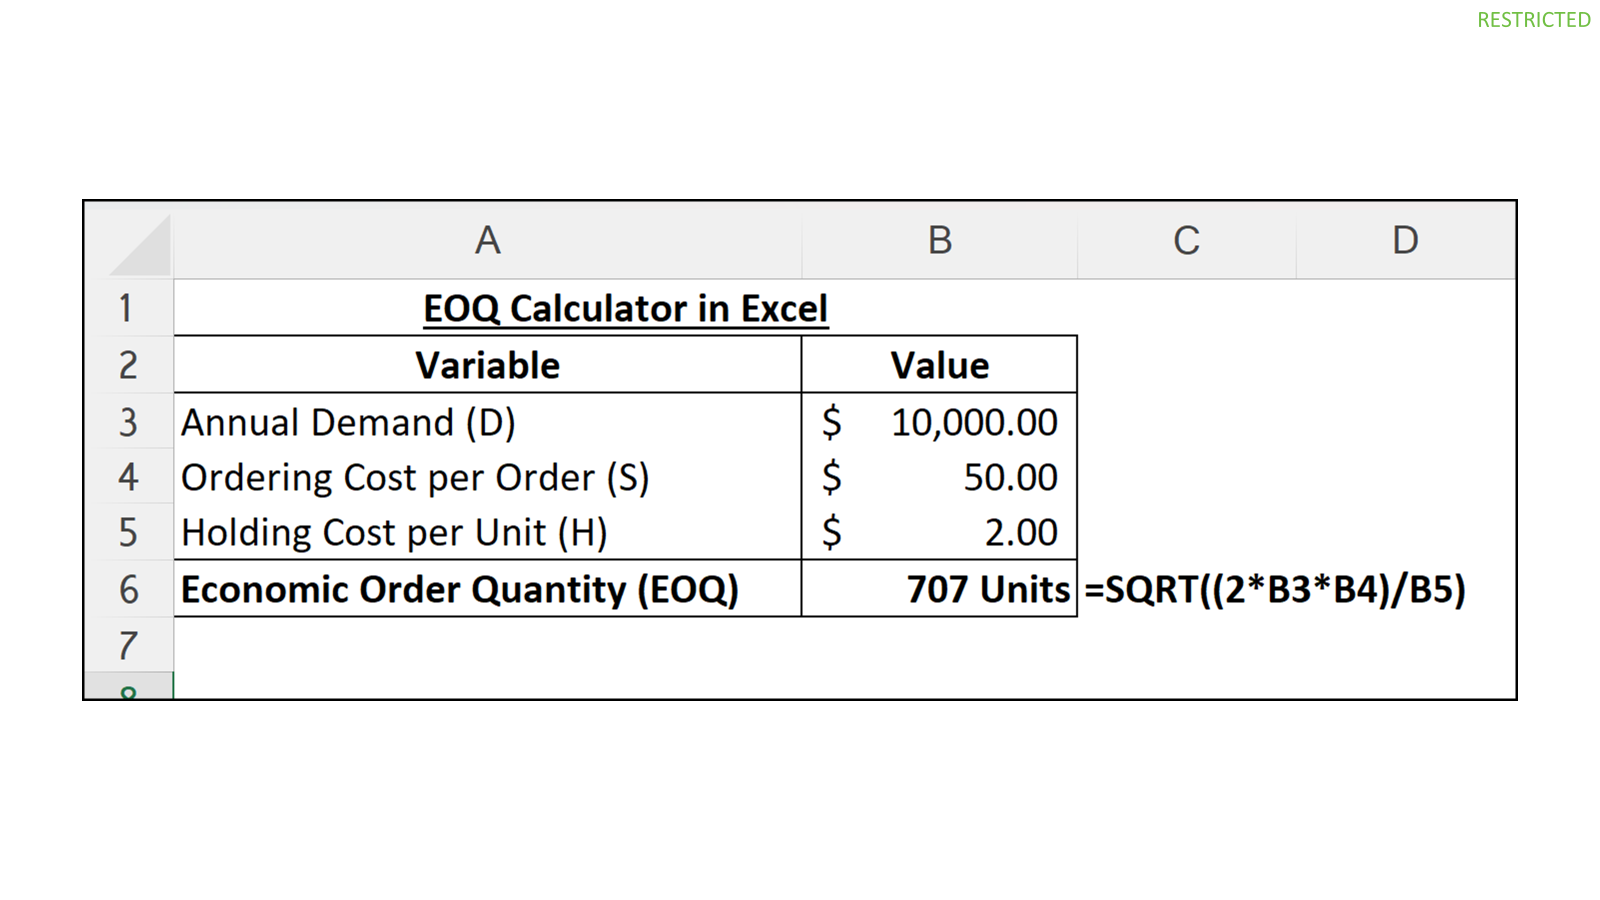
Economic Order Quantity, or EOQ for short, is an essential concept that informs inventory management by helping to pinpoint the most cost-effective order quantity. By using the EOQ formula, which incorporates both holding and ordering costs, you align your ordering processes with cost efficiency in mind. This tried-and-true method assists in reducing the wastage of resources and leveraging economies of scale. Inventory planning, a crucial aspect of business strategy, benefits significantly from the EOQ model. It fosters smart inventory management by dictating optimal stock levels to minimize costs while supporting consistent availability.
Think of EOQ as finding the sweet spot for your stock levels: it helps in striking a balanced approach to inventory planning, ensuring that you neither run out of products nor tie up too much capital in stock. Implementing inventory management software can simplify applying the EOQ model by automating the calculation and providing insights into inventory usage.
Now that we have a clearer idea about what Economic Order Quantity is and how it can streamline inventory management processes, we can consider integrating software solutions that facilitate these calculations and provide real-time tracking to ensure optimal inventory levels. Inventory management software not only offers a more granular view of current inventory usage but also identifies patterns that help in more accurate future planning. It becomes invaluable when dealing with the pros and cons of inventory measures, adapting quickly to the needs of a dynamic market.
Analyzing Average Inventory Outcomes
Reading Between the Lines: Interpreting Inventory Periods
When interpreting inventory periods, it’s not just about the numbers—it’s about the story they tell. A shorter average inventory period typically suggests a brisk sales pace and efficient stock replenishment, which can be indicative of good health in certain fast-moving sectors. Conversely, a longer inventory period might hint at overstocking issues or lagging sales, which could tie up capital unnecessarily and lead to storage or obsolescence costs.
But context is key, as some industries naturally have longer inventory periods due to the nature of the products they sell. Thus, it’s not only about how fast or slow the inventory moves but also about how these periods align with industry norms and your business strategy.
Leveraging Insights to Optimize Stock Levels
To leverage insights from your average inventory calculations and optimize stock levels, take a data-driven approach. Consider your sales velocity, the lead times from suppliers, and any seasonal patterns evident from past data. Forecasting tools are a boon here, predicting future sales to inform how much inventory to keep on hand. The goal is to minimize carrying costs without risking stockouts that could lead to missed sales opportunities and disappointed customers.
By employing these insights, you can establish a dynamic inventory threshold that adapts to changes in demand, keeps storage costs low, and ensures high turnover—a trifecta for inventory optimization.
Challenges and Limitations in Calculating Average Inventory
Navigating Seasonal Variances and Inaccuracies
Seasonal variances are a critical factor to consider during inventory management. To prevent inaccuracies, it’s best to analyze inventory levels in the context of seasonal trends and adjust your ordering accordingly. You might, for instance, increase stock before a busy season and decrease it as demand wanes. By keeping a keen eye on seasonal sales data, you can proactively adjust inventory to meet customer demand without overstocking or understocking.
It’s also helpful to review each season separately rather than relying on annual averages, which might mask significant fluctuations and lead to less informed decision-making.
Overcoming Common Average Inventory Pitfalls
Overcoming the common pitfalls in average inventory calculations requires vigilance and adaptability. One such pitfall, affecting inventory count accuracy, is neglecting to account for inventory losses such as returns and damaged goods—which can skew your inventory level perceptions. To mitigate shrinkage, systematic adjustments for these issues will ensure more accurate reflections of your usable stock.
Another challenge is forecasting errors, which could inflate the perception of losses. Relying too heavily on historical data without considering market trends and changes can lead to misjudgments. To avert this and capture accurate feedback, complement your historical data with market analysis and adjust your models accordingly.
Lastly, failure to integrate sales and inventory data can lead to discrepancies, potentially hiding areas of theft or loss within your business. Aligning these data streams ensures that purchasing aligns with sales activity, creating a cohesive inventory management strategy with fewer drawbacks.
Advanced Tips for Professionals
Mastering Excel for Swift Inventory Calculations
For professionals in inventory management, mastering Excel’s powerful functionality can make calculations swift and more accurate. Professionals skilled in the use of inventory management software recognize Excel as an indispensable tool. With its advanced capabilities, Excel can expedite inventory calculations and bolster precision. Make the most of ready-made templates—insert your initial and final inventory data for swift computations. The average inventory calculator within Excel’s suite can yield automated results based on the moving average method, accommodating the high volatility associated with inventory management.
By becoming adept with Excel’s extensive array of formulas and capabilities, you efficiently refine the process, mitigate the potential for manual errors, and promptly delve into data analysis to carry out vital adjustments to your stock levels. Though templates and formulas are a significant asset, customization congruent with your company’s particular requirements is essential for optimized operation.
Utilizing Inventory Forecasting to Stay Ahead
Staying ahead of the curve in inventory management means making friends with inventory forecasting. By analyzing past sales data, market trends, and seasonal fluctuations, inventory forecasting tools offer invaluable data points that can bolster the efficacy of your inventory predictions. These tools integrate sophisticated algorithms and machine learning, enabling you to estimate future stock needs with a higher degree of accuracy. This is particularly beneficial for ecommerce operations, which may experience rapid shifts in consumer demand.
Leverage this kind of inventory software technology to reduce the guesswork in inventory management, align stock levels with anticipated sales, and create a buffer against unforeseen fluctuations. Pros of adopting inventory forecasting include fewer stockouts, reduced carrying costs, and enhanced ability to respond to market changes swiftly.
FAQ Section
What makes knowing your average inventory crucial?
Knowing your average inventory is crucial because it helps maintain optimal stock levels, preventing overstocking or understocking. Understanding your average inventory is pivotal to effective inventory management practices, as it aids in maintaining optimal stock levels, thereby preventing both overstocking and understocking. Such a balance is not only vital for maintaining financial health—due to its influences on cash flow and storage costs—but also boosts customer satisfaction by assuring product availability without delays. Utilizing inventory units example calculations, businesses can determine their average monthly sales in terms of unit volume to enhance inventory measures and adjust stock appropriately.
How do you tackle seasonal variations in average inventory calculations?
To tackle seasonal variations in average inventory calculations, adjust your forecasting and ordering strategies to the expected surges or declines in demand. This is particularly crucial for businesses with merchandise like holiday decorations, where demand can fluctuate considerably. Additionally, perform regular inventory reports to keep a close eye on stock levels, maintain flexibility in your supplier agreements to handle sudden inventory changes, and utilize historical sales data for more accurate prediction models. To support efficient warehousing operations and maintain optimal inventory turnover rate, shelves should be restocked promptly to meet the seasonal demand without incurring excessive storage costs.
Can technological tools like ERP systems improve average inventory management?
Yes, technological tools like ERP systems can significantly improve average inventory management by offering real-time inventory tracking, automating reorder processes, and providing detailed analytics for better forecasting. ERP systems streamline operations, not just for inventory control but also for integrating accounting software, which is essential for financial accuracy. By leveraging modern inventory management software, companies experience an uplift in collaboration across departments, dovetailing different areas of business seamlessly. Adopting effective inventory software can advance the management of your stock levels, thus supporting the strategic analysis vital for business growth.
Is it necessary to compute the average inventory for every SKU?
While not every SKU may require individual average inventory calculations, doing so can be beneficial for items with significant sales volume or variability. Performing inventory analysis on each SKU helps businesses understand the ebbs and flows of their stock levels, especially for those with substantial sales or fluctuating demand. By focusing on specific inventory units with high impact, you can achieve more accurate inventory averages, helping to streamline stock control and enhance forecasting precision. To accurately calculate the average inventory for prioritized SKUs, remember to add the inventory counts at the end of each period—such as monthly—and divide by the number of periods, ensuring the inventory count is reflective of the true state of your inventory.
When identifying which SKUs to prioritize for individual average inventory tracking, consider their turnover rates, profit margins, and any seasonal trends that may influence demand. Companies using robust inventory analysis can ensure optimal stock levels, reduce carrying costs, and avoid stockouts or overstock situations.


