KEY TAKEAWAYS
The beta formula is a crucial component in financial modeling, particularly when assessing the volatility of a stock relative to the market. Here are three key takeaways about the beta formula:
- Assumptions of the Beta Formula: The beta formula assumes that historical data can predict future risk. It also presumes that the relationship between the stock’s returns and market returns is linear. Additionally, it assumes that market risk can be quantified and expressed through this linear relationship.
- Benefits of Using the Beta Formula: Utilizing the beta formula allows investors and analysts to measure a stock’s sensitivity to market movements effectively. It provides a benchmark for gauging investment risk, enabling better-informed decisions regarding portfolio diversification and management. By understanding beta, investors can align their portfolios with their risk tolerance and market predictions.
- Distinction Between Beta and Alpha: While beta measures volatility relative to the market, alpha assesses an investment’s performance in comparison to a benchmark index. A positive alpha indicates better performance than the benchmark, whereas beta mainly informs on how much risk is involved compared to market movements.
Overall, understanding these aspects of the beta formula enhances one’s ability to conduct rigorous financial analysis and manage investment portfolios strategically.
What is Beta in Finance?
Understanding the Basics
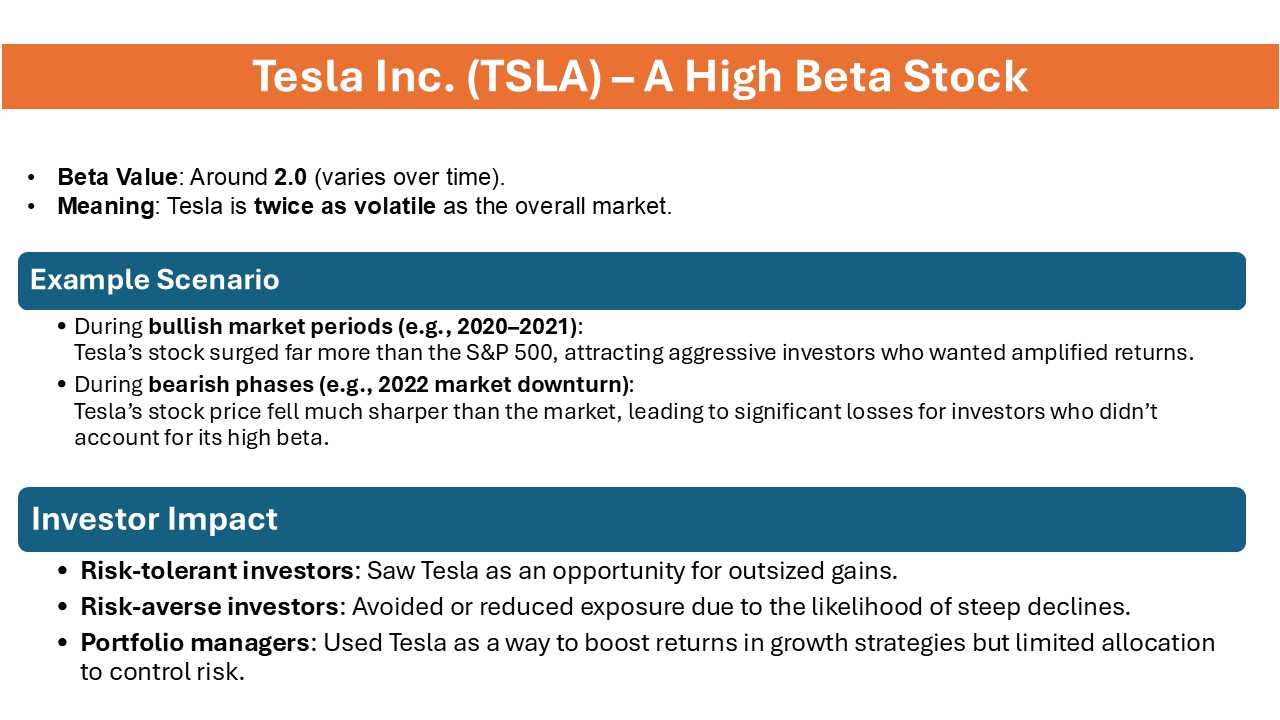
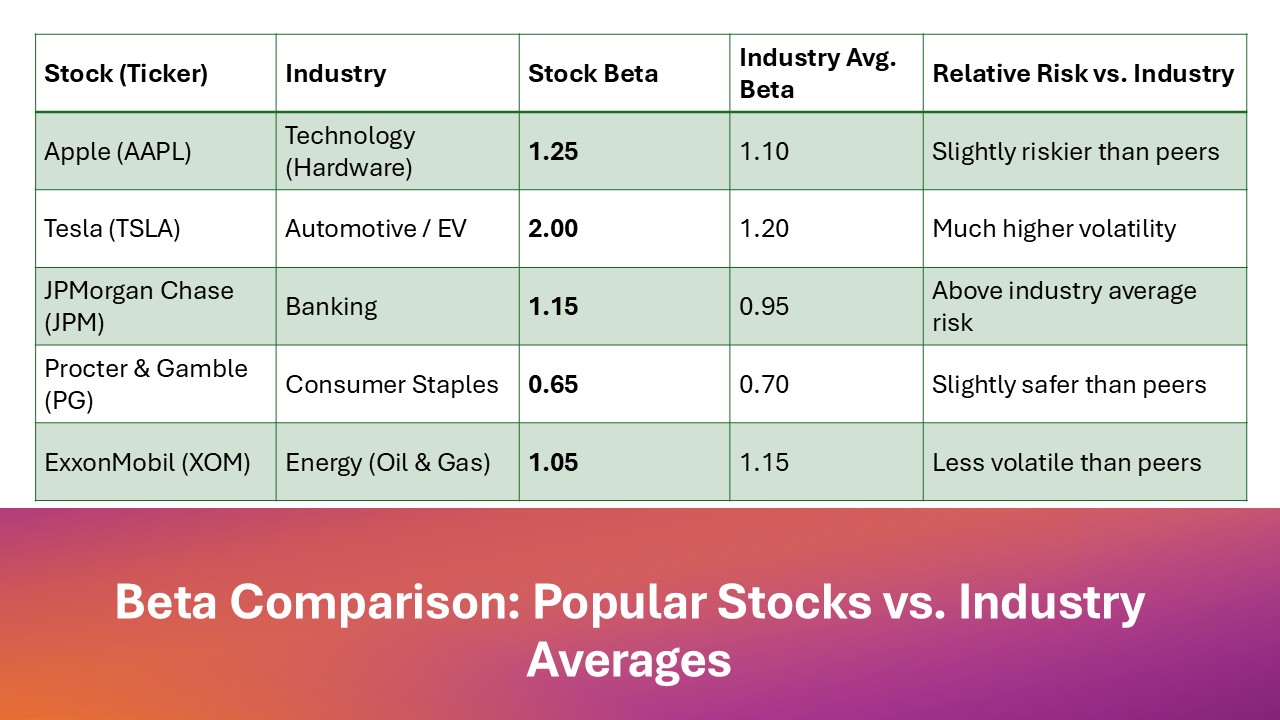
At its core, beta measures the sensitivity of a stock’s returns relative to the overall market returns. A beta value of 1 indicates that the stock’s price tends to move with the market. If a stock has a beta of 1.5, it is considered 50% more volatile than the market, while a beta of 0.5 implies less volatility. Investors can use these beta constant values to assess the potential risk versus reward of individual stocks, which is crucial when making investment decisions.
Beta’s Role in Risk Assessment
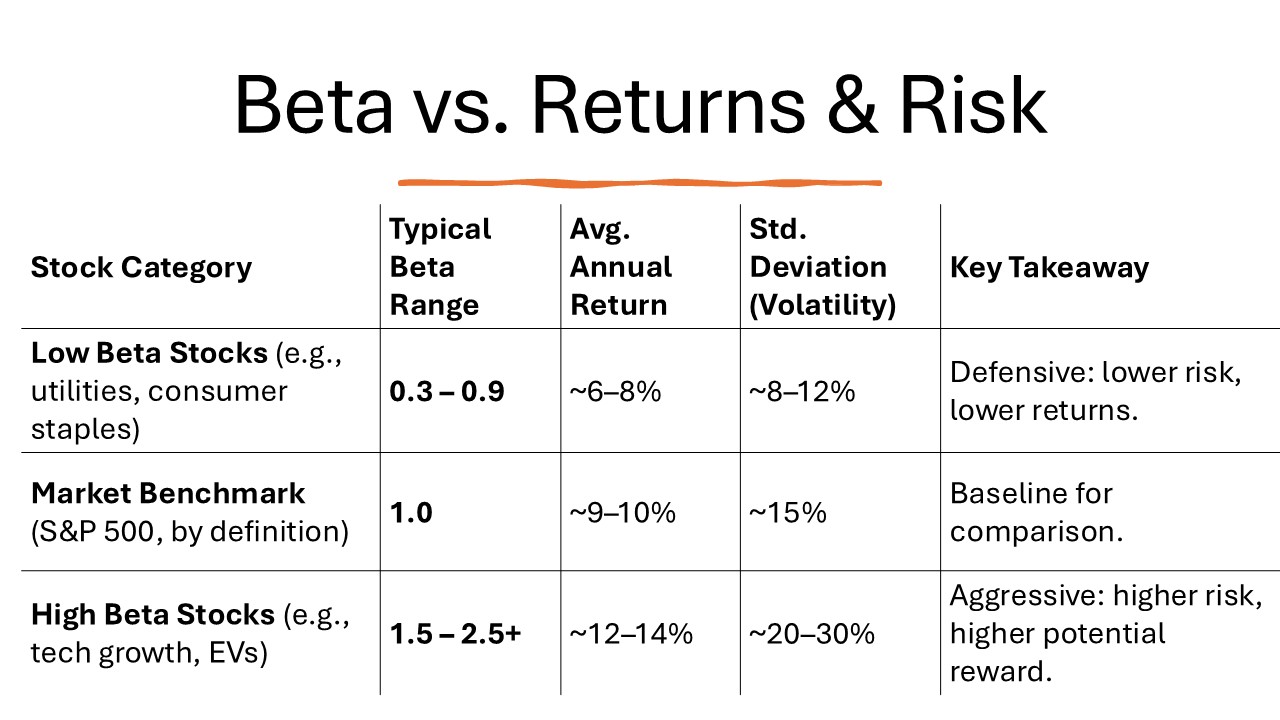
Beta is integral in assessing an investment’s risk profile. By comparing a stock’s volatility to the broader market, beta allows investors to evaluate potential risks. Stocks with high beta values are typically seen as riskier but offer the possibility of higher returns. On the other hand, low beta stocks are viewed as more stable and safer, albeit often with lower potential returns. This risk assessment helps you align your investment choices with your risk tolerance and financial goals.
The Importance of the Beta Formula
Linking Beta and Market Volatility
Beta serves as a direct link to understanding market volatility by quantifying how much a stock’s price moves relative to market swings. It encapsulates the concept that different stocks react differently to market changes. A higher beta value suggests that the stock experiences larger fluctuations compared to the market, reflecting greater volatility. Conversely, a lower beta signals that the stock is less reactive to market changes, indicating stability. This linkage aids investors in deciphering which stocks may withstand turbulent markets better.
How Beta Guides Investment Decisions
Beta significantly influences investment decisions by offering insights into potential risks and returns. For risk-averse investors, stocks with low beta values are often preferred as they typically exhibit less price fluctuation, reducing the risk of significant losses. Conversely, those aiming for higher returns might opt for high beta stocks, accepting increased risk for potentially greater gains. By incorporating beta into their strategies, investors can better tailor their portfolios to align with their specific risk appetites and financial objectives.
Calculating Beta: Methods and Formulas
Levered vs. Unlevered Beta Explained
Levered beta, often referred to as ‘equity beta,’ includes the company’s debt in its risk assessment, reflecting the total risk faced by equity shareholders. It accounts for financial leverage and is a direct measure of a stock’s volatility compared to the market. In contrast, unlevered beta, or ‘asset beta,’ strips out the effects of debt, providing a clearer picture of the risk inherent to the company’s assets alone. This distinction helps investors understand how leverage impacts risk and informs decisions about risk management and asset performance.
Step-by-step Beta Calculation Process
Calculating beta involves a series of clear steps to ensure accuracy and relevance. Here’s a simplified guide:
- Collect Data: Gather historical price data for the stock and the benchmark market index over the same period.
- Calculate Returns: Compute the returns for both the stock and the market index, typically using percentage change formulas.
- Covariance Calculation: Determine the covariance between the stock’s returns and the market’s returns. This measures how the two variables move together.
- Variance Calculation: Calculate the variance of the market’s returns to understand its volatility.
- Beta Formula: Use the formula Beta = Covariance (Stock, Market) / Variance (Market) to find the beta value.
This process helps quantify the stock’s volatility relative to the market, providing a foundational piece of data for investment decisions.
Interpreting Beta Values
High vs. Low Beta Stocks
High and low beta stocks each offer distinct advantages and challenges. High beta stocks, which have a beta greater than 1, tend to fluctuate more dramatically than the market. They are suited for investors seeking growth opportunities and willing to embrace higher risks for potentially greater rewards. In contrast, low beta stocks, with values less than 1, exhibit less volatility and are typically preferred by conservative investors focusing on capital preservation. These stocks often provide stability during market downturns, offering peace of mind.
Using Beta to Predict Stock Behavior
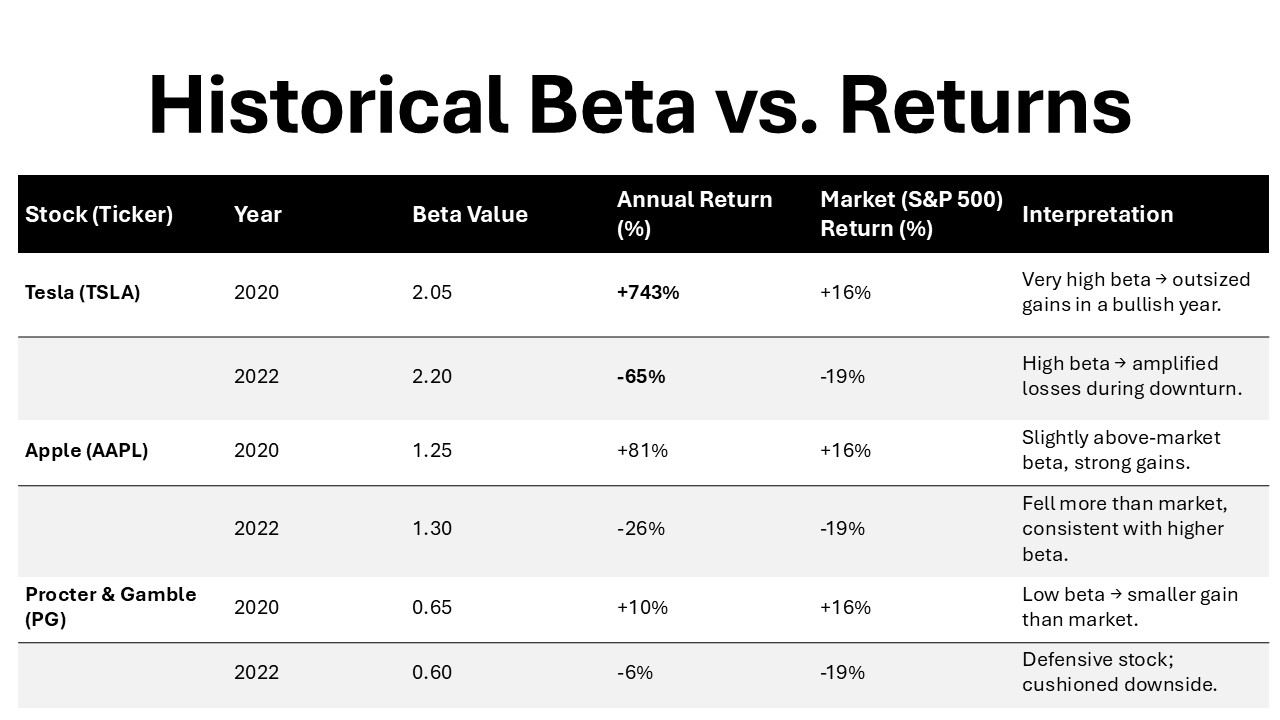
Beta can be a useful tool in predicting how a stock might behave in relation to market movements. High beta stocks generally move in the same direction as the market but with more pronounced volatility. When the market trends upward, these stocks may outperform, but they can also suffer larger losses during downturns. Low beta stocks, however, tend to show muted reactions to market changes, offering stability and predictable returns. This predictive capability assists you in setting expectations and aligning investment strategies with market conditions.
Criticisms and Limitations of Beta
Warren Buffet’s View on Beta
Warren Buffett, renowned for his investment acumen, has famously critiqued the reliance on beta as a measure of risk. He argues that beta is a flawed indicator, as it doesn’t consider a company’s underlying value or potential long-term performance. Instead, Buffett emphasizes a focus on fundamental analysis—assessing a company’s business model, management quality, and economic moat. He believes true investment risk lies in the potential for a permanent loss of capital rather than short-term market volatility.
Common Misconceptions about Beta
Several misconceptions can skew perceptions of beta’s utility in finance. Firstly, many mistakenly equate beta directly with risk, whereas it actually measures volatility relative to the market, not overall investment risk. Secondly, some believe a low beta stock is inherently safe, yet it can be risk-laden if the company’s fundamentals are weak. Lastly, beta is often seen as a reliable predictor of future performance, but it doesn’t account for unexpected market events or company-specific news. Understanding these misconceptions can enhance your investment decision-making process.
Practical Applications of the Beta Formula
Incorporating Beta into Portfolio Management
Incorporating beta into portfolio management can enhance your strategy by aligning risk and return expectations with your investment goals. By mixing high and low beta stocks, you can balance the potential for growth with the need for stability. High beta stocks might elevate potential returns during bull markets, while low beta stocks can mitigate volatility in bearish phases. Adjusting beta exposure in alignment with market forecasts and personal risk tolerance helps optimize portfolio performance.
Using Beta with the Capital Asset Pricing Model (CAPM)
Beta plays a pivotal role in the Capital Asset Pricing Model (CAPM), which estimates the expected return of an asset based on its beta and market risk premium. The formula is: Expected Return = Risk-Free Rate + [Beta * (Market Return – Risk-Free Rate)]. By inputting beta into the CAPM, you can determine whether a stock is expected to offer adequate returns for its risk level. This aids in identifying undervalued stocks and making more informed investment decisions.
Conclusion
The beta formula is a cornerstone of modern finance, used extensively in valuation models, regression analysis, and portfolio risk assessment. At its core, beta measures the sensitivity of a stock’s returns relative to market movements, often derived from the slope of a regression line between stock returns and market returns. Platforms like Yahoo Finance, Capital IQ, and other websites provide ready-to-use beta figures, though professional analysts often compute them using closing prices, formula inputs, and market covariance for greater accuracy. A simple β calculator or an Excel slope function can replicate this process, ensuring investors have clarity on how a stock or portfolio aligns with broader market dynamics.
There are multiple variations of the beta formula depending on the module and the context of analysis. For example, unlevered beta isolates business risk without the effect of debt financing, while bottom line beta adjusts for capital structure through a company’s equity ratio and target D. These adjustments are vital when applying beta in discount rate estimation or integrating it into the Capital Asset Pricing Model (CAPM) and even Arbitrage Pricing Theory. In practice, portfolio beta calculation examples rely on weighted averages of individual stock betas, scaled by their portfolio market value and equity shares held.
The usage of beta extends beyond academic formulas—it is actively applied in trading, ETFs, and gold ETFs to measure exposure to systematic risk versus unsystematic factors. During recessions, for example, high-beta equities tend to amplify uncertainty, while low-beta investments may provide stability. Analysts often download data points from financial databases or listings, then run analyses to generate outputs that guide decision-making. A key drawback of beta measurement is its reliance on historical data, meaning that shifts in marketplace conditions or default scenarios may reduce predictive accuracy.
For learners and practitioners, certification programs, finance course catalogs, and professional newsletters often provide structured guidance on beta. Many firms also offer premium templates, productivity templates, and Excel templates to simplify calculations and visualize results. The key takeaways beta users should remember are: it is a measure of systematic risk, it informs the discount rate in asset pricing, and it helps assess volatility in equities. The bottom line is that, despite its limitations, beta remains central to investment valuation models, portfolio construction, and understanding the beta number that drives long-term financial outputs.
FAQs
What makes beta a valuable tool for investors?
Beta is valuable as it quantifies a stock’s volatility relative to the market, helping investors assess risk and align it with their investment preferences. It aids in constructing diversified portfolios by balancing high-risk, potentially high-reward investments with safer, stable ones, thus optimizing returns while managing market fluctuations.
How does beta help in understanding market risk?
Beta provides a clear measure of how much a stock’s price is expected to move in relation to market fluctuations. It helps investors understand the risk level of a stock compared to the market, allowing for informed decision-making. A high beta indicates higher volatility, while a low beta suggests stability against market trends.
Can beta accurately predict future stock performance?
Beta does not predict future stock performance but rather measures past volatility compared to the market. While it offers insights into expected stock behavior relative to market movements, it doesn’t account for future events, company-specific factors, or market changes that could impact performance.
Why is it important to define beta in finance for investors?
Defining beta is crucial as it equips investors with a tool to assess stock volatility and risk compared to the market. Understanding beta helps tailor investment strategies to individual risk tolerances and goals, facilitating better portfolio diversification and informed financial decision-making.
How is the beta coefficient of a stock calculated?
The beta coefficient is calculated by dividing the covariance of a stock’s returns with the market’s returns by the variance of the market’s returns. This formula quantifies how much the stock tends to move in relation to market fluctuations, providing insights into its relative risk and volatility.