KEY TAKEAWAYS
- The cost of equity represents the return expected by investors for holding shares in a company and is critical in determining whether a company can satisfy its shareholders and attract further investments.
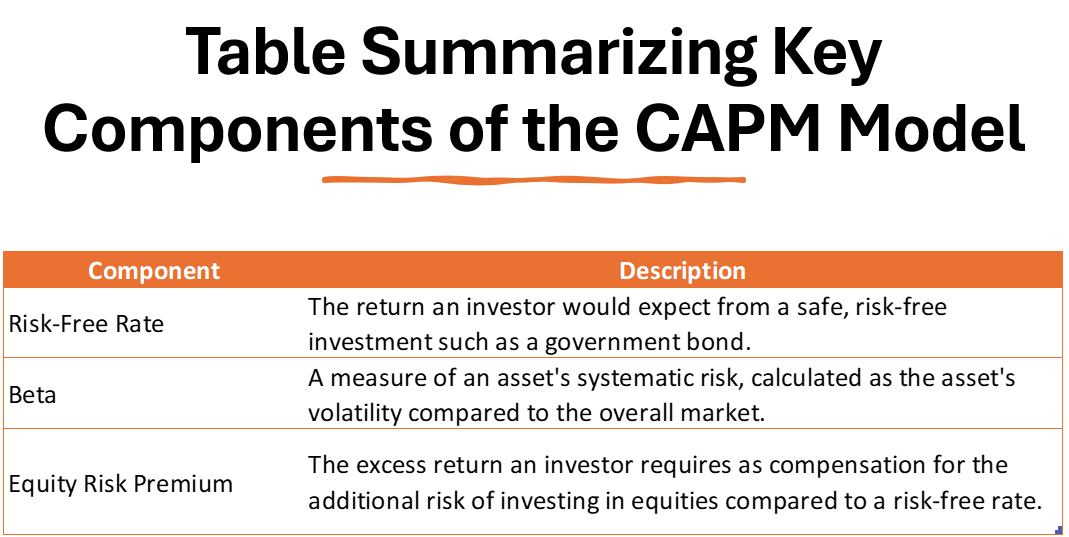
- There are three main components that make up the cost of equity: the Risk-Free Rate, Beta, and Equity Risk Premium, and understanding each is essential for accurately calculating this financial metric.
- The cost of equity can be calculated using reliable methods, one of which involves plugging the values of the Risk-Free Rate, Beta, and Market Risk Premium into the formula: Cost of Equity = (Beta × Market Risk Premium) + Risk-Free Rate (Rf Rate) , providing a quantifiable expectation of investor returns.
Significance of Calculating Cost of Equity
The significance of calculating the cost of equities stretches far beyond a mere number—it’s your compass in the vast sea of financial decisions. For investors, it’s like a lighthouse, guiding them towards investments that promise a return that’s worth their risk. In the corporate world, it’s the yardstick companies use to measure if their projects can sail the high seas of investor expectations and still deliver value.
In nutshell, understanding the cost of equity lets everyone involved navigate the chopv waters of finance with a much clearer map. It’s fundamental in stock valuation, strategic planning, and maintaining the delicate balance between pursuing ambitious ventures and keeping financial stability afloat.
Breaking Down the Basics
Key Components of the Cost of Equity
The cost of equity isn’t just pulled out of thin air; it’s based on a trio of essential factors that come together in a neat little financial package. First up, there’s the Risk-Free Rate, usually reflected by long-term government bond yields like treasury bond / securities. Think of it as the return you would expect from an absolutely safe investment, with zero risk.
Following that is Beta, a coefficient that measures how much a company’s share price ping-pongs around in relation to the market. A high beta indicates bigger price swings, hence higher risk (and the need for higher returns).
And then there’s the Equity Risk Premium, which can be seen as the extra reward investors demand for choosing the rollercoaster of stocks over the merry-go-round of risk-free assets.
When these components join forces, they shape the cost of equity, a beacon that helps determine whether sailing into a company’s waters will be profitable for investors.
Understanding the Formula for Calculation
Grasping the formula for calculating the cost of equity can be a breeze if you break it down into digestible bites. Ultimately, it all boils down to the classic Capital Asset Pricing Model (CAPM) equation, which looks a bit like this: Cost of Equity = Risk-Free Rate + Beta * (Market Return – Risk-Free Rate).
Here’s what that really means: You start off with the Risk-Free Rate to establish a foundation. Then, you sprinkle in a pinch of Beta to account for the volatility of your investment compared to the market. Finally, you season it with the Market Return minus the Risk-Free Rate. This difference is what we call the Equity Risk Premium.
Put it all in the financial blender, and presto—you’ve got yourself the cost of equity. It’s the theoretical return rate that investors should expect, given the risks they’re taking.
A company’s equity cost relative to its competitors provides insight into how investors perceive its riskiness within the industry.
Simple Steps to Calculate Cost of Equity
Example of a Basic Calculation
Let’s see how this recipe comes together in the kitchen of financial calculation. Picture a company that’s got a Beta of a feisty 1.8, indicating it’s more volatile than the market. The risk-free interest rate is at a calming 3%, and the market is willing to offer you an equity risk premium of 5% for braving the rocky stock waters.
Using the trusty CAPM model, the formula is set up as follows: Cost of Equity = (1.8 * 5%) + 3%. With a flick of the calculator, the cost of equity is revealed to be 12%. What this means for investors is that to dip their toes into this particularly splashy pool of shares, they’d need to have the hopes of at least a 12% return to justify taking on those bigger waves.
CAPM Approach to Cost of Equity Determination
The CAPM approach is like your reliable GPS when traversing the terrain of investment decisions. It offers a focused lens to gaze at the cost of equity. By factoring in individual stock risk relative to the market (Beta), risk-free rate, and equity risk premium, it can be a handy tool for investors looking to steer clear of rough patches.
In practice, CAPIM gives investors a cruisable route: It allows for a systematic evaluation of investment risk and potential returns. So, when someone’s mapping out the worth of plunging into a particular stock, this model helps to spotlight the expected earning rate that justifies the risks taken. It’s the method financial experts routinely rely upon for its relative simplicity and broad usefulness in scrutinizing investment opportunities.
Beyond the Basics: Advanced Considerations
Incorporating Risk Factors into Your Calculations
When calculating the cost of equity, factors that are specific to the company can really throw a wrench into the works if not considered. These can be all sorts of things: financial stability, debt levels, industry quirks, and operational risks unique to the company.
To navigate these waters safely, you might have to adjust the Beta to better reflect the risk associated with the specific company, rather than the market at large. It may require you to dive deep into the company’s history, their financial statements, and any industry-specific tidbits that could affect stability and growth.
And here’s a pro tip: always keep your data up-to-date. Using stale figures can skew your calculations, leaving investors sailing blind. By keeping a keen eye on these factors and conducting a sensitivity analysis, you sharpen your ability to predict a more accurate range for the cost of equity, giving you the confidence to make waves in your investment decisions.
Common Pitfalls and How to Avoid Them
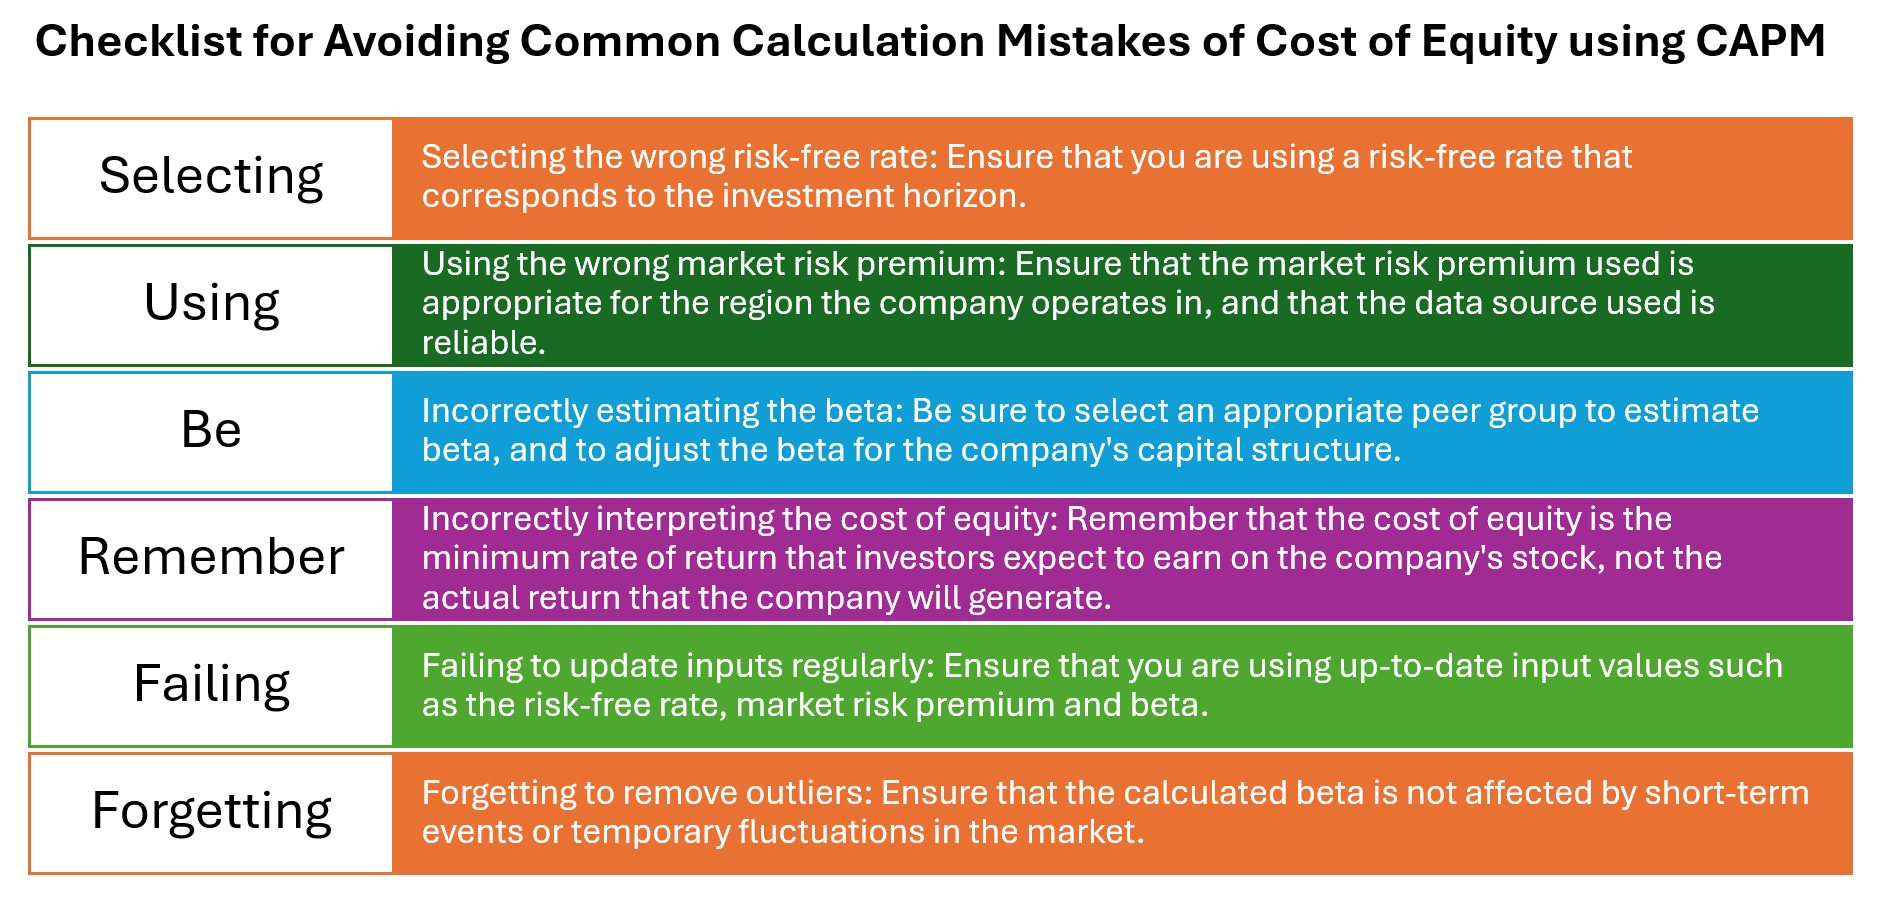
When it comes to calculating the cost of equity, many can navigate into stormy waters without the right precautions. A common pitfall is mismatching time frames. For instance, using a long-term risk-free rate with predictions for short-term projects can skew your calculations. You can avoid this by matching the time horizon of your risk-free rate with the expected duration of your investment horizon.
Another hiccup involves underestimating the equity risk premium. Picking a number that’s too low because it looks good today can lead to undervaluing the risks tomorrow. Instead, use historical data to better estimate future premiums—think of it as having your financial umbrella handy, even when the sun’s shining.
Also, beware of over-relying on Beta. It’s a handy indicator of volatility, but it doesn’t capture the full picture of a company’s risk profile. Broaden your horizon by also considering factors such as liquidity, regulatory impacts, and competitive dynamics.
By sidestepping these pitfalls with a mix of foresight and thorough analysis, you’ll be able to chart a more accurate and profitable course for investors.
Real-world Application
When to Use Cost of Equity in Business Decisions
Your navigation through the business seas calls for the cost of equity at various junctures. Picture it as a vital piece of your decision-making toolkit when you’re considering whether to plunge into new waters, like an expansion or a takeover, or when you’re charting the course for where to steer your ship next.
It’s particularly handy when you’re pondering whether to fund ventures through issuing new shares. The cost of equity can tell you if it’s worthwhile, depending on the return that investors will expect. This figure is also crucial when assessing the attractiveness of dividends or buyback offers; after all, you’d want to ensure they’re lucrative enough for the shareholders.
Simply put, use the cost of equity whenever your choices could impact your investors’ returns, guiding your business toward decisions that promise to be financially fruitful for everyone on board.
Cost of Equity in Financial Modeling and Valuation
In the world of financial modeling and business valuation, the cost of equity takes center stage. It’s like a beacon in the fog, essential for creating various models such as the Dividend Discount Model (DDM) and Discounted Cash Flow (DCF). These models are the compass by which analysts gauge the intrinsic value of a company, looking through the prism of potential future cash flows and dividends. (Dividend discount model is also known as Dividend Capitalization model)
For example, in the Gordon Growth Model, a form of the DDM, the cost of equity calculation helps figure out the present value of infinite dividends that grow at a steady rate. If you’re working on a DCF model to capture the value of irregular cash flows, the cost of equity will be critical in discounting those future bucks back to today’s dollar, giving you the power to compare apples to apples.
Whether you’re a financial analyst, an investor, or a business leader, mastering the use of the cost of equity in your models will ensure you’re not just adrift at sea but sailing towards the right investment horizon.
Comparing Cost of Equity and Other Financial Metrics
Cost of Equity vs. Cost of Debt
Venturing into the financial landscape, you’ll find that the cost of equity and the cost of debt are like two different terrains. While the cost of equity is like a wild, untamed forest with no definitive path — riskier and requiring a guide (higher returns) — the cost of debt is more like a well-paved road, generally less risky, and therefore, less costly.
Why the difference? The interest expenses on the cost of debt offer a comforting tax shield because they are tax-deductible. But the cost of equity doesn’t enjoy this benefit, which means companies typically offer a higher rate to entice investors.
To finance their operations, companies usually rely on a combination of equity and debt financing. However, equity is generally considered more expensive for companies to raise than debt capital.
Additionally, in the moment when a company falls into troubled waters (think: liquidation), debt holders get lifeboats and are rescued first, while equity investors are often left swimming. This ordering in the capital structure pecking order justifies the higher returns demanded by equity holders. Remember to always weigh these differences when you’re deciding how to finance your business expedition.
As a company adds more debt to its capital structure, the potential risk to all stakeholders increases. This is because the debt must be repaid regardless of the company’s profitability. As a result, the risk of financial distress increases, which can lead to a higher WACC. Thus, careful consideration must be given when adding debt to the capital structure.
The Relationship with Weighted Average Cost of Capital (WACC)
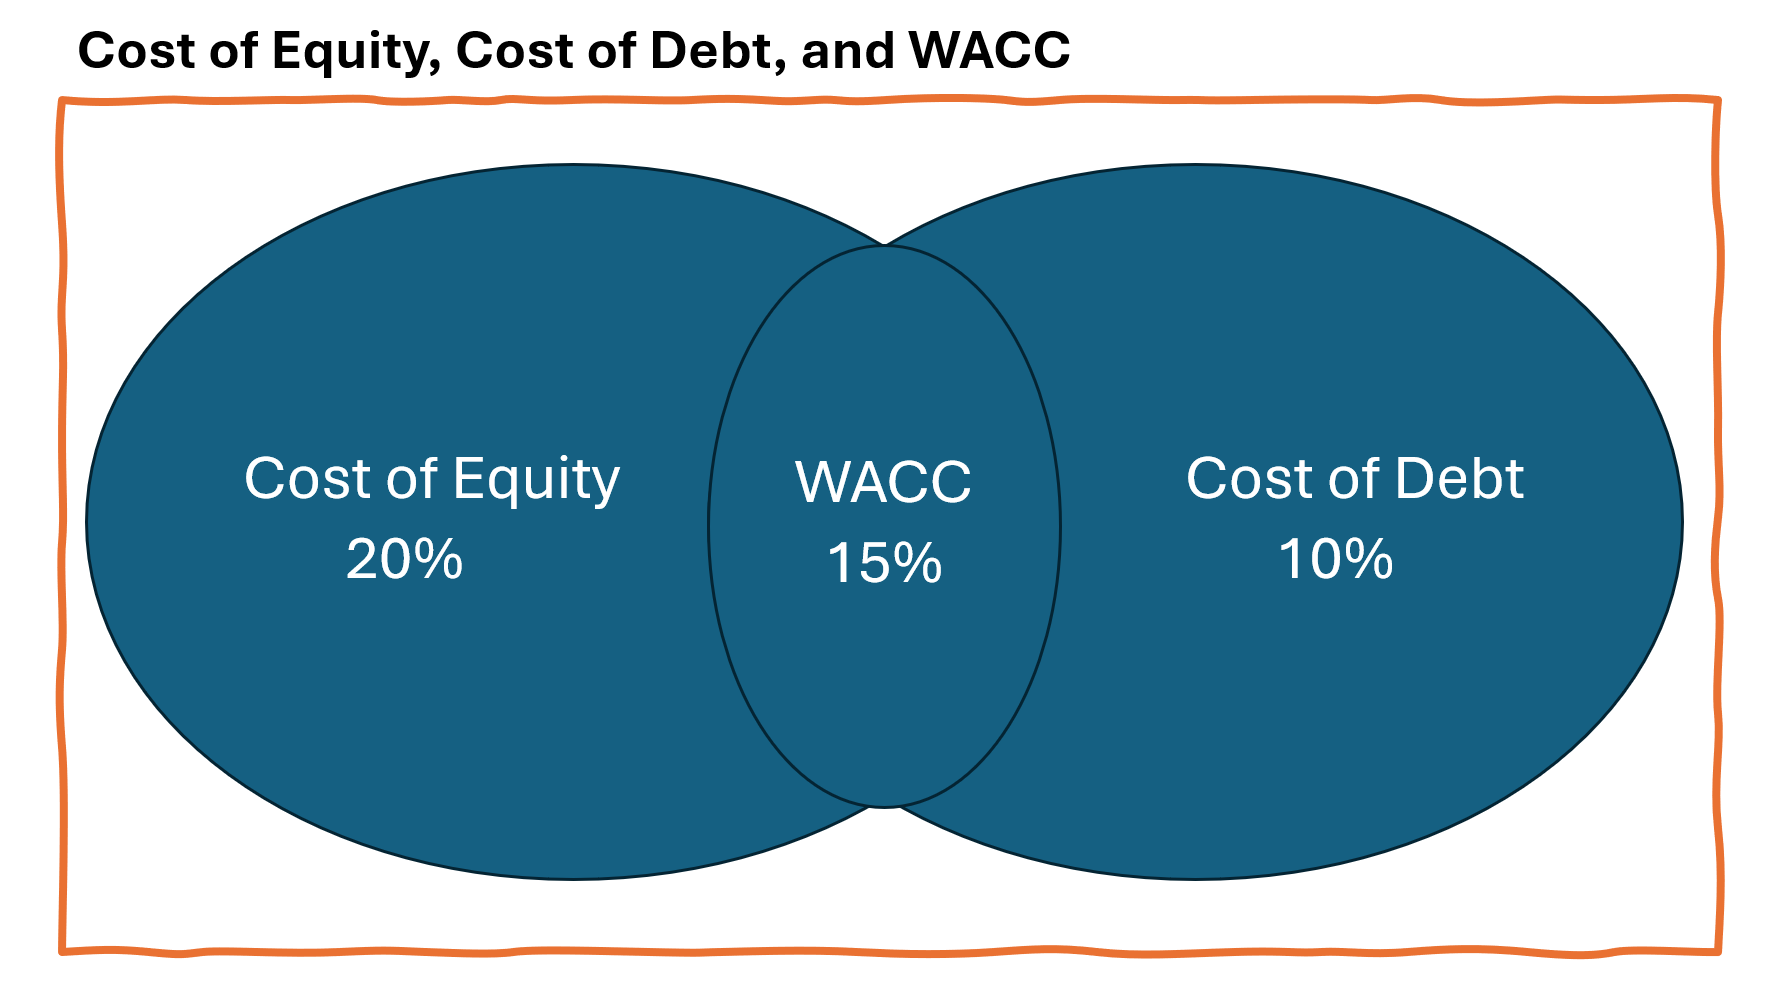
Embarking on the relationship between the cost of equity and WACC, think of WACC as the overall average rate that a company expects to pay to finance its assets. It’s a blend, a financial smoothie of sorts, which combines the cost of equity with the cost of debt.
The cost of equity is one important ingredient in this mix, typically contributing a higher flavor of risk and return to the WACC recipe. Since WACC factors in the entire capital structure, recognizing how the cost of equity influences it is like understanding how a spice impacts a dish’s overall taste.
When a company’s management reviews potential investments, comparing their expected returns to the WACC helps them determine whether an investment is worth the risk. If the return on an investment is higher than the WACC, you’ve potentially found a treasure. Conversely, if it’s lower, you might be sailing towards a financial storm.
FAQ Section
What Is a Good Cost of Equity?
A “good” cost of equity can be as elusive as a calm sea, because it really depends on the context. Generally, a value between 6% and 8% is considered par for the course in the U.S. But keep in mind, this figure can shift with market conditions, industry standards, market capitalization and company performance. The better a company’s prospects, the lower the cost of equity, as investors require less return for lower risk. Aim to weigh this figure against your industry average and long-term company goals to really know if you’ve hit the sweet spot.
Can Cost of Equity Be Negative?
While the idea of a negative cost of equity might seem stranger than a fish riding a bicycle, here’s a reality check – it’s theoretically possible but highly unlikely. In financial terms, it would suggest investors are willing to pay, rather than receive, a return for their investment risk, which seems counterintuitive. If you find yourself staring down what appears to be a negative cost of equity, take a step back. It could very well signal a red flag in your Equity Cost calculations or an extraordinary market anomaly.
How Does Company Size Impact Cost of Equity?
Company size can play a big role in the cast of factors that determine the cost of equity. Larger companies often have more established track records, a diversified business structure, and greater resources to weather economic storms, which could lead to a lower cost of equity due to perceived stability. Smaller companies, on the flip side, tend to have higher costs of equity. Their shares often ride the market waves more dramatically, and they may face increased risks from competitive pressures and limited resources, demanding higher returns from investors to compensate for these potential vulnerabilities.
Why Is It Important to Regularly Recalculate Cost of Equity?
Regularly recalculating the cost of equity is like frequently checking your compass on a long-haul voyage; it ensures you’re still on the right path. Market conditions, interest rates, and your company’s beta can evolve, meaning today’s cost of equity could be old news tomorrow. Keeping this calculation fresh gives you the most current map of the investment landscape, informing strategic decisions and helping to maintain investor confidence by showing that you are in tune with the current value of the risk they are taking.
The cost of equity has a significant impact on a portfolio as it represents the minimum rate of return that investors expect for investing in a particular company’s stock. The cost of equity is used to calculate the weighted average cost of capital (WACC), which represents the minimum rate of return required for a company’s investors
By leveraging the cost of equity, organizations can make better financial decisions, ensuring that new ventures align with the expectations of investors and stakeholders while optimizing returns and managing investment risk. Organizations strategically leverage the equity cost to evaluate potential projects.
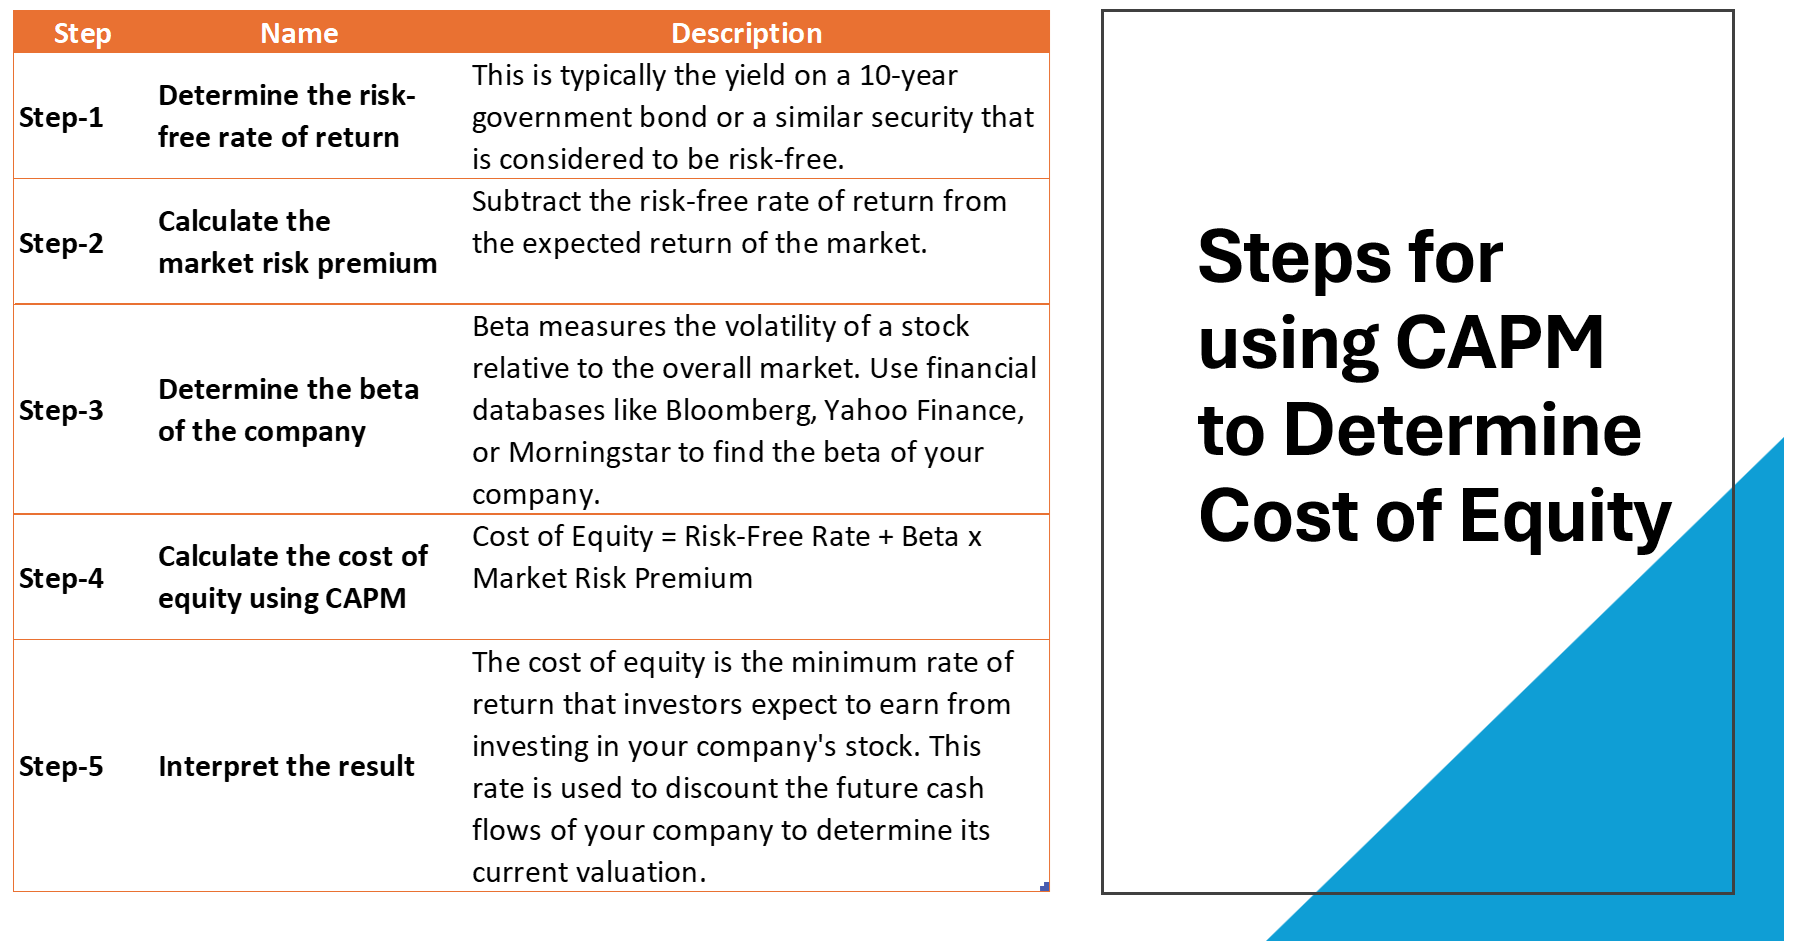
How to determine and estimate Cost of Equity
Determining and estimating the cost of equity centers around using proven models like CAPM, which factors in the risk-free rate, the stock’s beta, and the expected market return. Begin with the risk-free rate, typically the yield of a 10-year government bond. Next, determine the stock’s beta via financial databases or by comparing the stock’s historical returns to the market’s. Lastly, estimate the expected market return based on historical premiums. Combine these in the CAPM formula: Risk-Free Rate + Beta * (Market Return – Risk-Free Rate), and you’ll have your cost of equity estimate.